Note to Readers: Strategist Larry is in the process of digesting the inter-market data reaction post Jackson Hole. In the meantime, this chaotic selloff that we are currently seeing is heavily, heavily mitigated by the guidance we’ve been providing inside our Community. Some of this guidance has been published publicly in our Youtube Content and Emails as well.
Out of service to our Community, we have done our part to help you navigate this market. Now it is up to you to see where you want to take it from here.
Entering Jackson Hole, here are some things to know.
% of SPX names with RSI >70 got to a level last seen in June 2020.
20-day cumulative short covering into August 16th is in the 99th percentile.
10-day moving average of notional value traded in US equities is at the lowest level in two years.
Per BofA, cheapest hedging opportunity in 14 years… VIX in the low 20s…
Source: Goldman Sachs, Bank of America
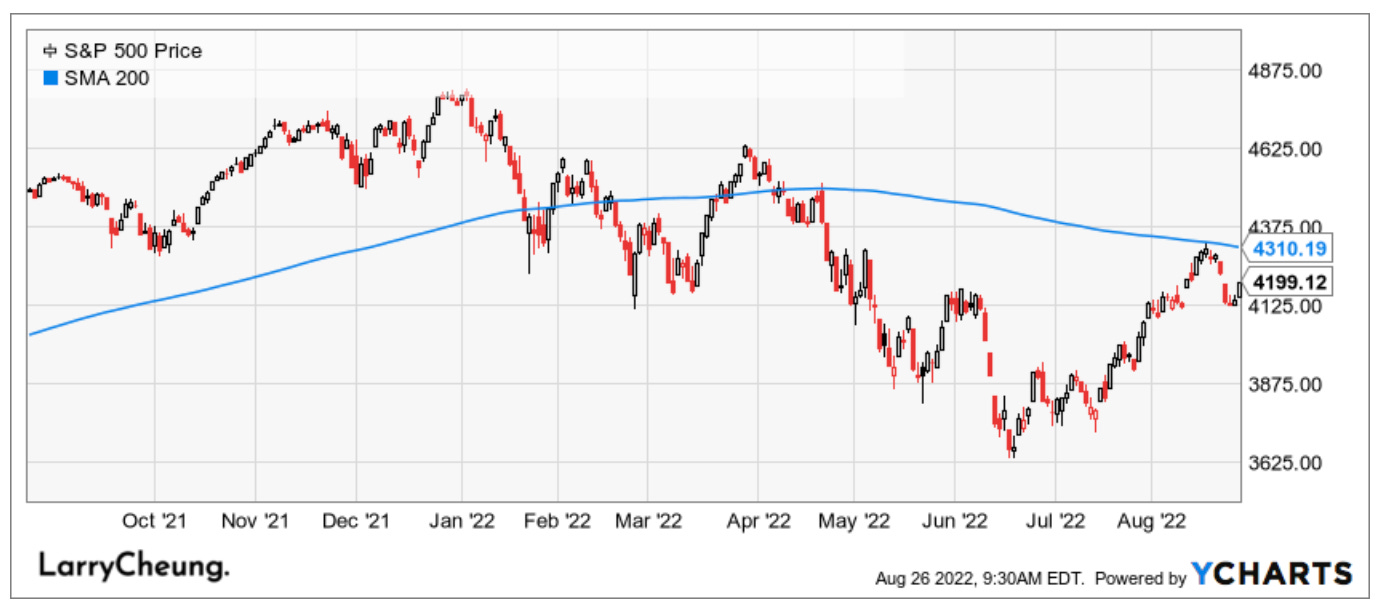
Macro Chart In Focus
Analyst Team Note:
One of the most important drivers of equities are bond yields.
Per BofA’s Michael Hartnett (arguably the most accurate strategist on Wall St.), if bond yields "double-top" during the next 4-8 weeks (i.e. UST 10-year yield fails to surpass 3.48%), there will be no new lows in stocks.
However, the current view is that yields have yet to peak:
History shows that U.S. CPI of >4% requires a Fed Funds of >4%
The last time oil prices denominated in Euros were this high, the ECB policy rate 4.25% (not 0.5% like right now)
Crypto, Chinese tech, biotech, EM debt, lead indicators of higher yields, yet to confirm “peak yields”
We’re still seeing U.S. fiscal policy easing (more stimulus and student loan forgiveness)
Key areas that determines inflation generally remain inflationary: commodities (the war in Europe continues), labor (unemployment rates remain very low across the board), housing (beginning to crack, but simply decelerating from bubble levels).
US business activity contracted for a 2nd straight month in August, reflecting softer demand at both the manufacturers and the service provider level. Excluding the economic pullback in the early months of the pandemic, the August figure is the weakest print in data back to 2009.
Per S&P Global Market Intelligence, “The data signaled further disconcerting signs for the health of the US private sector… Demand conditions were dampened again, sparked by the impact of interest rate hikes and strong inflationary pressures on customer spending”.
On the bright side, inflation metrics eased for both factories and service providers. Input price growth decelerated, and the gauge of output prices fell to the softest pace in 18 months.
Source: Bloomberg, S&P Global
Chart That Caught Our Eye
Analyst Team Note:
Credit spreads have widened significantly in 2022, and at one point reached levels consistent with a mild recession. Right now, IG spreads are marginally wider than the long-term average while HY spreads are in-line with the non-recession average.
This leads us to believe that IG seems more attractive and offers better protection relative to HY.
And investors are starting to notice this. Per BofA, IG bonds have seen inflows for the past 4 weeks while HY bonds experienced its biggest outflow in 9 weeks.
We want to take a moment to thank Interactive Brokers for being one of our Channel’s trusted Partners and to inform my audience of the special features they have given that our online friends here closely follow Chinese Internet stocks (BABA/Tencent).
Much of Larry’s audience is concerned about the US ADR issue of Chinese Stocks being delisted.