Note to Readers from Larry: The market continues to reach higher-highs in 2023 as AI Leader NVDA has shifted the market paradigm with all of the SOXX Semiconductor ETF companies staging 15-20% rallies in a matter of days. Given the importance of Semiconductors in the Nasdaq QQQ ETF, the Nasdaq is now back at 2023 highs.
While previous hype cycles such as Blockchain ultimately faded, the Semiconductor supercycle is a different story. Companies within the SOXX ETF are real companies with real (strong) cash flows.
Key Investing Resource: Strategist Larry uses Interactive Brokers as his core brokerage. Feel free to check out IB. I currently park excess cash (yielding 4.5%+ on idle cash) at Interactive Brokers
In our emails, we will provide the following coverage points:
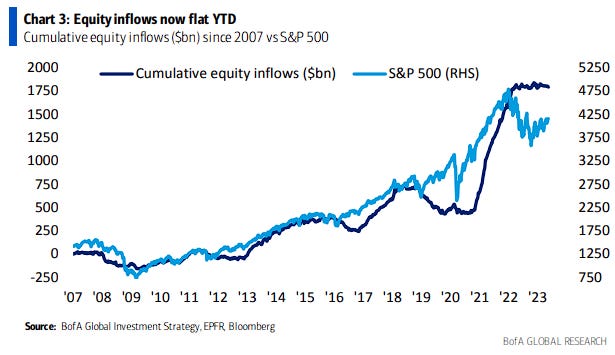
Global equity flows are now flat YTD, in contrast to big inflows of $175bn in '22, $949bn in '21 and $182bn in '20…
Meanwhile, inflows to cash YTD at $756bn, which compares with inflows of $11bn in '22, $315bn in '21 and $917bn in '20…
Macro Chart In Focus
Analyst Team Note:
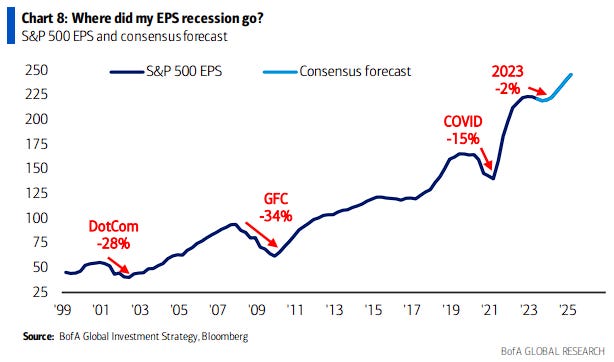
The market has flipped from EPS recession to no recession as inflation, fiscal stimulus, labor market boosted nominal GDP which should be good news unless the debt ceiling ends fiscal stimulus and slow deterioration in labor market accelerates…
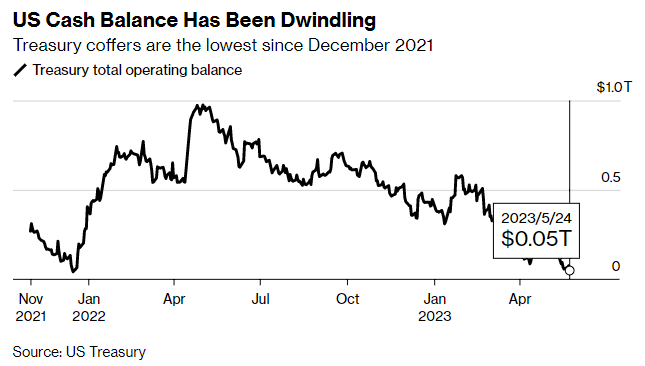
The amount that sits in the US government’s checking account fluctuates daily depending on spending, tax receipts, debt repayments and the proceeds of new borrowing. If it gets too close to zero for the Treasury’s comfort that could be a problem. As of Wednesday there was less than $50 billion left
Chart That Caught Our Eye
Analyst Team Note:
“Given higher sector weights in staples, financials, energy and utilities, Europe is essentially a value investment. I should have paid more attention to just how cheap it got, particularly after the Euro had declined by 50% vs the US$ since 2010. By September 2022, Europe’s P/E multiple hit a post-2006 low relative to the US. While there were valid concerns at the time about Europe’s energy situation, rising inflation and exposure to a shuttered China, investors were receiving an enormous discount for taking European equity exposure, and I should have paid more attention to that. Europe’s outperformance is likely to have a ceiling since US companies generate higher returns on equity and higher returns on assets, as shown in the table. But everything has a price, and a 35% P/E discount was apparently it. As things stand now, the discount is still large from an historical perspective.” - Michael Cembalest, JPM Asset & Wealth Management
Sentiment Check
Make sure to check Larry’s most recent market updates via his personal newsletter.


 from 2006 to the present. Europe experienced the largest P/E discounts versus the US over this timeframe in Q3 2022 at about 35%.")

