Note to Readers from Larry: My next Substack/Patreon Strategy Release will be the first few days of April. I am digesting the latest market moves to formulate my next plan for markets.
I hope you enjoyed the China rally and were able to participate in it. In this geopolitical environment, China is more tactical than an investment, but the alpha is nice.
Strategist Larry uses Interactive Brokers as his core brokerage. Feel free to check out IB. I currently park excess cash (yielding 4%+ on idle cash) at Interactive Brokers.
In our emails, we will provide the following coverage points:
“Cash offers ~5% returns, a compelling alternative to the S&P 500 index especially given that our year-end target (S&P at 4000) suggests limited near-term upside. If financial stability worsens rather than improves, a backdrop of easier Fed / tighter credit hasn’t been good for the S&P 500. But sentiment based on our Sell Side Indicator (SSI), suggests that this and other reasons to worry about stocks are well aired, and argue for a positive surprise – especially vs. last year’s bullish complacency” - BofA
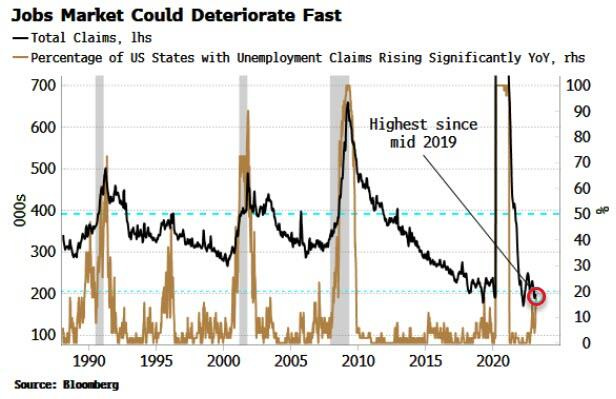
Macro Chart In Focus
Analyst Team Note:
Since Nov 9, 2022, 10 of 11 sectors have seen their bottom-up price targets increase, with only Discretionary lower.
GDP estimates for Q1 2023 continue to tick higher across Wall Street, with the consensus now around +2.5%. This is up from ~0% at the beginning of the year.
Although the headline unemployment claims figure has remained low, almost 20% of states are experiencing a year-on-year increase of more than 25% in jobless claims.
This is usually a sign of further significant deterioration in the job market and often leads to a nationwide surge in unemployment claims, which has historically been a precursor to a recession.
Chart That Caught Our Eye
Analyst Team Note:
Consumer confidence historically drops every time the Fed cuts rates. Further proof that rate cuts aren’t bullish.
Sentiment Check
Strategist Larry’s Latest Popular Tweet (make sure to follow):