Note to Readers: There are certainly pockets of value after the market selloff that has repriced the indices lower by nearly 10% over just a 2-week period. We believe this is a stock-selection environment. The indices are too dependent on the Mega Cap stocks; the Mega Cap stocks are too dependent on the Macro outlook. And the macro outlook still leaves much to be desired. Macro will get better in mid-2023 and beyond in our opinion, but is it appropriate to quickly price in mid-2023 in September 2022? We welcome market surges - more importantly, we want to help you do something with it.
Stock-selection and thematic selection will likely work better in this environment. We have a few stock-selection ideas (already up 5% since publication inside our Patreon Community), but believe there’s still more room to run, and that dips can be bought in these select names. Remember, think about every company you hold - do they make sense in this environment?
“We think the lows for this bear market will likely arrive in Q4 with 3,400 minimum downside and 3,000 if a recession arrives. From there, we think prices will recover to our base (3,900) or bear (3,350) case June 2023 targets. In the very near term, if back end rates fall, stocks may hold up or even rally until later this month when QT potentially increases and earnings estimates are likely revised lower.” - Mike Wilson, Morgan Stanley
Macro In Focus
Analyst Team Note:
Bull Case
Fed does its last outsized (>25pbs) hike in September, which may include ending the tightening cycle in December
QT ramps up to its maximal caps without any increase in vol or yields
CPI continues to move lower, accelerating the pace of its declines
WTI remains at/below $100 but perhaps more critically does not see rapid increases
Equity positioning increases as markets stabilize
Bear Case
Fed continues with its outsized rate hike cadence in Nov/Dec bringing Fed Funds above 4.0%
QT puts upward pressure on yields, retesting YTD high of 3.47% in10Y
CPI remains in the 8% - 9% range
WTI moves back above $100, in response to either supply disruptions and/or an increase in demand from China
Positioning remains light with increases to short leverage
Yesterday, two indicators of services activity gave very different signals. The S&P PMI index fell to contractionary territory while the ISM index moved higher into expansionary territory.
There’s a couple differences between the two indicators that can help us understand the recent divergence.
S&P Global designs its sample to be representative of the broader industry according to workforce size. ISM, on the other hand, simply surveys its members, which tend to be from larger businesses. Therefore, S&P Global arguably captures more smaller and medium-sized businesses than ISM.
ISM was originally named the non-manufacturing index, as it includes construction and mining. S&P Global, on the other hand, focuses purely on services industries but excludes retail.
ISM is an equally weighted average of four component indexes—business activity, new orders, employment, and supplier deliveries; S&P Global is simply the business activity index.
Chart That Caught Our Eye
Analyst Team Note:
S&P 500 gross positioning has been dropping sharply while Nasdaq gross positioning has been growing… This pretty much shows the level of uncertainty and mixed feelings that investors have about the market.
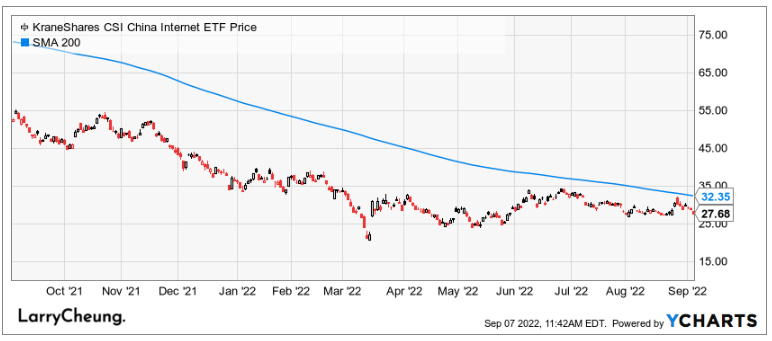
We want to take a moment to thank Interactive Brokers for being one of our Channel’s trusted Partners and to inform my audience of the special features they have given that our online friends here closely follow Chinese Internet stocks (BABA/Tencent).
Much of Larry’s audience is concerned about the US ADR issue of Chinese Stocks being delisted.