Make sure to check out Interactive Brokers above as idle cash now will yield more than 4.5% as the Fed just raised rates.
Note to readers from Larry: Hope everyone had a great Labor Day weekend! We’re off to a very good start to the week, and we look forward to providing more insights to our Community. Make sure to follow me on Twitter and Instagram for informal commentary.
Key Investing Resource: Strategist Larry uses Interactive Brokers as his core brokerage. Feel free to check out IB. I currently park excess cash at Interactive Brokers. Check it out. It’s a great brokerage.
In our emails, we will provide the following coverage points:
Research from the Federal Reserve Bank of San Francisco found that interest-rate increases can reduce potential economic output for over 12 years, challenging the traditional belief that policy interventions are neutral in the long run. The economists from the Fed observed smaller economies tied to a larger economy's currency and found that policy shocks could persistently slow economic activity over many years.
For instance, a 1% interest-rate hike could result in a 5% reduction in real GDP after 12 years.
Since QT began, the Fed has reduced its bond holdings by about $1 trillion. Currently, the central bank's portfolio stands at $7.4 trillion, down from its peak of $8.4 trillion last year. The reduction in holdings is pushing the Treasury to depend more on the private sector for federal debt purchases. Fortunately, private groups like money-market funds have been readily acquiring the increased Treasury bills issued by Washington.
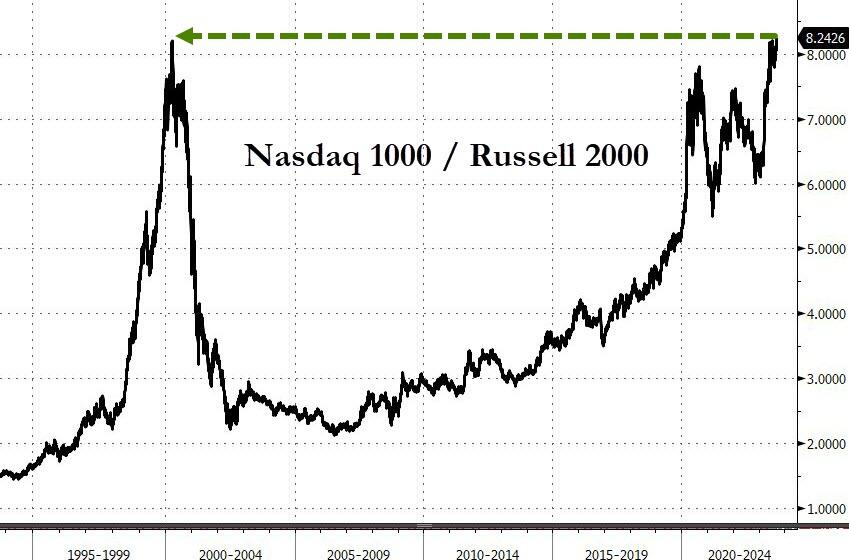
Chart That Caught Our Eye
Analyst Team Note:
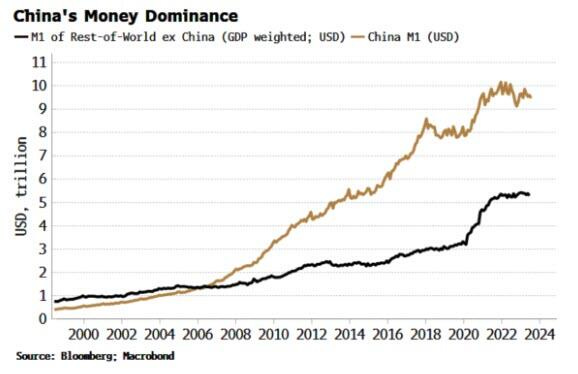
Since 2007, China's M1 money supply in dollar terms has vastly exceeded the GDP-weighted M1 of other nations. With its M1 standing at 67 trillion CNY ($9.5 trillion), it surpasses the U.S. by 30% despite the U.S. economy being a third larger. This discrepancy doesn't even account for Chinese household demand deposits, which, if included, would expand China's M1 by over 50%.
Sentiment Check
Make sure to check Larry’s most recent market updates via his personal newsletter.