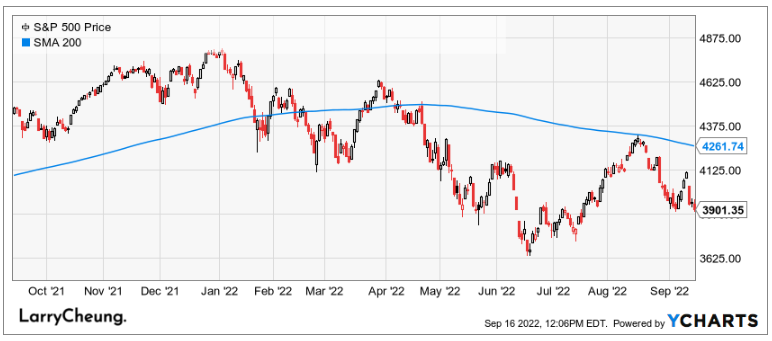
9.16.22: The S&P 500 flirts with bear market territory ahead of September FOMC next week.
Key U.S. and China brief market notes by Larry's Analyst Staff Team for our Public Email List
Note to Readers: Our audience (public and private) who have observed Strategist Larry’s opinion knows that we’ve been advocating for extreme caution and defensive positioning in this market (higher cash balance, long positions in Staples, and reduced exposure in Cyclicals). That strategy is now paying off, and we truly wish we had even more investors in our Community reduce risk to be in a position of strength as certain pockets of the market begin to represent areas of value.
Our mid-month September Investment Strategy update will be released later this evening. It is NOT too late to position appropriately for the remainder of this year. We are urging investors to spend time to assess the current environment so that they are making proper decisions.
We have provided strong defensive guidance in this environment, and upon the right time, will issue offensive guidance when the time is right.
Now is NOT the time to be passive. Now is the time to take your knowledge to the next level and prepare yourself for the next stage in markets. Share this email with friends and family. Join us today, and get ready for the market’s next big move.
This email is brought to you by Interactive Brokers, one of our preferred brokerages to buy HK-Listed Shares in our China Internet Equity Coverage Universe.
In our emails, we will provide the following coverage points:
Brief Snapshot of U.S. & China markets and valuation
Our Analyst Team’s Chart in Focus
U.S. & China Upcoming Economic Calendar Snapshot
Notable Chart from Media Outlets
Fear & Greed Index Recap
I hope you find this newsletter to be insightful and enjoyable! - Larry and Team
U.S and China Markets Brief Snapshot 🇺🇸 🇨🇳
(Powered by our Channel Financial Data Provider YCharts)
S&P 500 Index: 3901.35
KWEB (Chinese Internet) ETF: $27.67
Analyst Team Note:
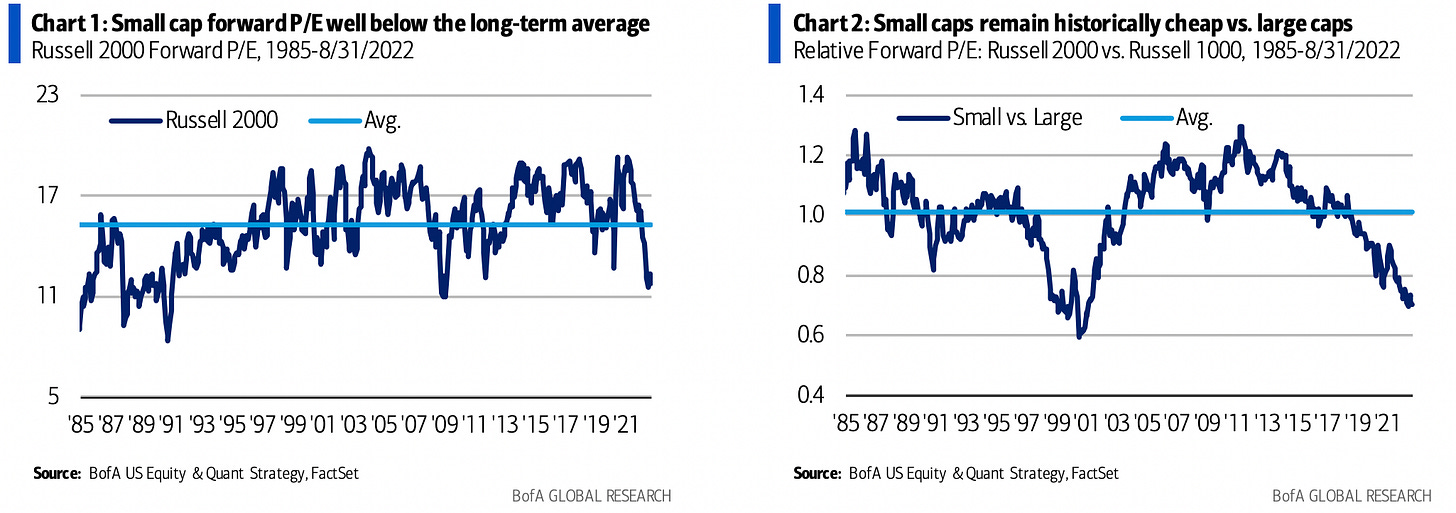
I’ve been doing a lot of digging into the small-to-mid cap space, where I believe lies the greatest opportunities for alpha in the market today. Small cap multiples are at trough levels and have never been this cheap vs. large caps since 2000.
Per BofA, “The relative forward P/E multiple of the Russell 2000 vs. Russell 1000 suggests that small caps could outperform large caps over the next ten years”.
Personally, I’m looking into small-cap financial and real estate names. Based on my preliminary research, it seems that recession is the base case priced into these stocks.
-Tim Chang (Larry’s Analyst Staff Team)
Macro Chart In Focus
Analyst Team Note:
Fedex blewup today. As of writing, it’s down 22.2%.
Fedex withdrew its FY2023 guidance and pre-announced Q1 numbers, which were atrocious.
FedEx prelim 1Q adj EPS $3.44, est. $5.10
FedEx prelim 1Q Rev. $23.2B, est. $23.54B
FedEx prelim 1Q Adj. oper income $1.23B, est. $1.74B
The company attributed its miss on higher fixed costs as volume decelerated (both international and in U.S), noting macroeconomic trends worsened later in quarter, and expenses lagged worsening demand.
This shocking announcement comes at a time when global PMIs are moving dangerously close to contraction territory (sub-50 reading). Per BofA’s Industrial Momentum indicator (r = 0.73 to global PMIs), global PMI will likely enter contraction territory with 2-3 months.
Upcoming Economic Calendar
(Powered by our Channel Financial Data Provider YCharts)
U.S Economic Calendar (Upcoming Data Points)
China Economic Calendar (Upcoming Data Points)
Analyst Team Note:
New home demand has deteriorated over the last four months due to worsening affordability. In early August, homebuilder traffic and cancellations rates appeared to improve (relative to the low July base) as mortgage rates briefly fell below 5%, however, over the last month, mortgage rates have spiked back above 6% to the highest level since 2006.
While the short-to-medium term outlook will continue to be shaky as rates/prices stabilize, we see the long-term drivers of demand (demographic tailwind and shortage of homes) remaining intact.
Chart That Caught Our Eye
Analyst Team Note:
There’s a lot of things that caught our eye from the sell-side after this week’s inflation report. Here were two of them.
Exhibit 7: Inflation for food at home (FAH) has substantially outpaced food away from home (FAFH). Obviously this is largely dependent on where you live, but after almost a decade of cheaper food at home, it seems like eating out may actually be cheaper than making food at home.
Exhibit 8: An important metric to track is the spread between CPI (tracks consumer inflation) and PPI (tracks producer inflation). CPI minus PPI is a spread commonly used as a proxy for profit margins. In the past, CPI has outpaced PPI, which was a tailwind for margin expansion.
Fast forward to today and we’re seeing producer prices substantially outpacing consumer prices. This does not bode well for profit margins and we believe margins will experience substantial compression as inflation rages on.
Sentiment Check
We want to take a moment to thank Interactive Brokers for being one of our Channel’s trusted Partners and to inform my audience of the special features they have given that our online friends here closely follow Chinese Internet stocks (BABA/Tencent).
Much of Larry’s audience is concerned about the US ADR issue of Chinese Stocks being delisted.
Interactive brokers allows investors to buy HK-listed shares of Alibaba, JD, Tencent, and other brand name Chinese Internet companies on the HK market. This will effectively reduce any confusion or work you will have to do in case there is the event of delisting US ADRs


