Note to Public Readers from Larry: Folks, hope you had a good weekend! I’ve sent out two notes for today - one was the Daily Market Note for 8/7 and the other is my Collab announcement with Wall Street Prep to get my Community the best possible pricing on analyst education courses.
Make sure to check out Interactive Brokers above as idle cash now will yields 4.8% on all uninvested cash balances as the Fed just raised rates.
Rising oil prices, which surged by over 18% in the past month, are pressuring U.S. inflation rates, reversing the trend of decreasing inflation. These increases are affecting various sectors, from daily commutes to the production of goods such as plastics, clothing, and fertilizers. The initial spike in oil prices came after Russia's invasion of Ukraine last year but began to moderate following U.S. interventions, including utilizing the SPR. However, recent production cuts by Saudi Arabia and Russia, coupled with investor optimism regarding the U.S. economy, have led to a renewed surge in prices.
In May, nearly 40% of the U.S. starter homes were bought with cash, a trend driven by real estate investors targeting affordable properties. This has resulted in a competitive market for many potential homeowners, especially in pricier regions.
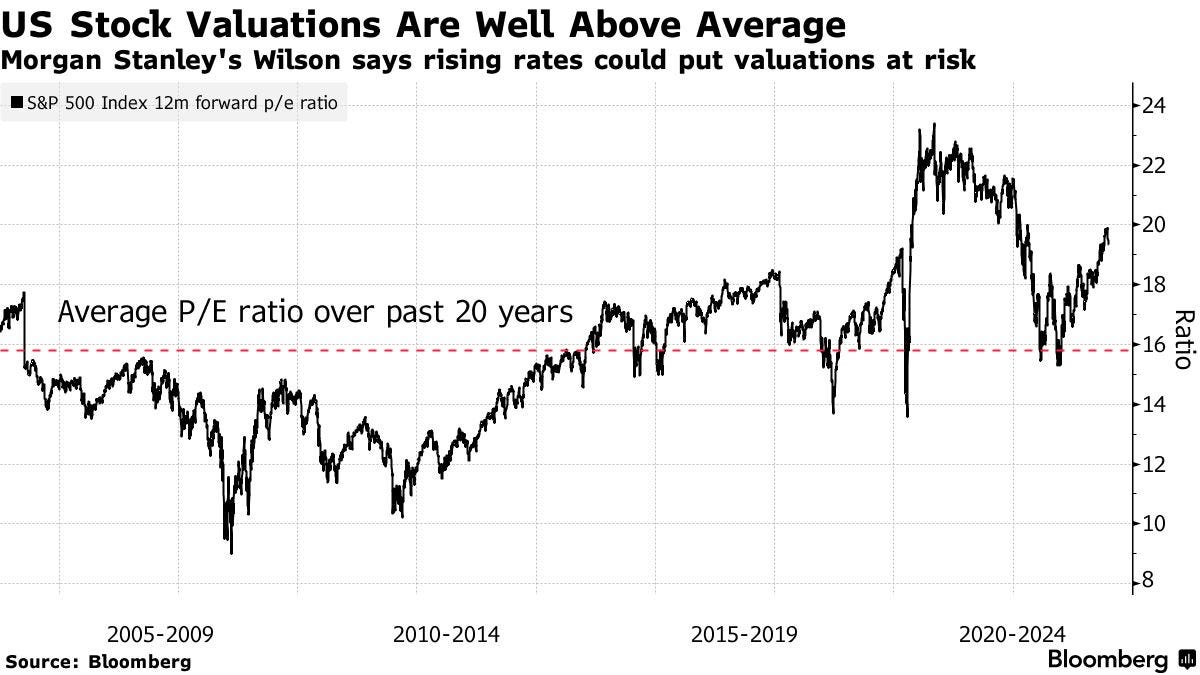
Chart That Caught Our Eye
Analyst Team Note:
In Q2, global M&A value decreased by 6.5% from Q1 to $873.4 billion, marking a 33.7% decline on the year and a 41.9% drop from the peak in Q4 2021, making it one of the weakest quarters since the 2020 pandemic downturn. However, the count of deals remains robust, close to record highs. This discrepancy between the deal value and count results from two main factors: the rise in interest rates and the vast unused funds in corporate and financial sponsors.
Specifically, increased interest rates have affected LBOs, pushing borrowing costs up and reducing deal sizes. Corporations, especially in the US, have amassed significant cash reserves, amounting to over $5.8 trillion, prompting a shift towards revenue acquisition via M&A due to stagnant or declining organic profit growth.
Sentiment Check
Make sure to check Larry’s most recent market updates via his personal newsletter.