Our public newsletter is brought to you by our friends at YCharts. If you’re an advisor, you know just how many hats you have to wear: sales, marketing, portfolio management, relationship building, accounting, and a dozen other functions that fall on your plate, and often all at once. But that’s where YCharts steps in. YCharts is a one-stop shop for all your investment research and client communication needs. With its intuitive interface, pre-built research templates, and custom reporting tools, you’ll save us hours of time each week and be equipped with the tools and data you need to uncover better and newer investment ideas.
Visit https://go.ycharts.com/larry-cheung or click the link in the show notes to start your free YCharts trial, and get 15% off your initial subscription (new customers only).
Note to Readers from Larry: I’ll be back with more commentary next week. Enjoy your weekend. :)
Key Investing Resource: Strategist Larry uses Interactive Brokers as his core brokerage. Feel free to check out IB. I currently park excess cash at Interactive Brokers. Check it out. It’s a great brokerage.
In our emails, we will provide the following coverage points:
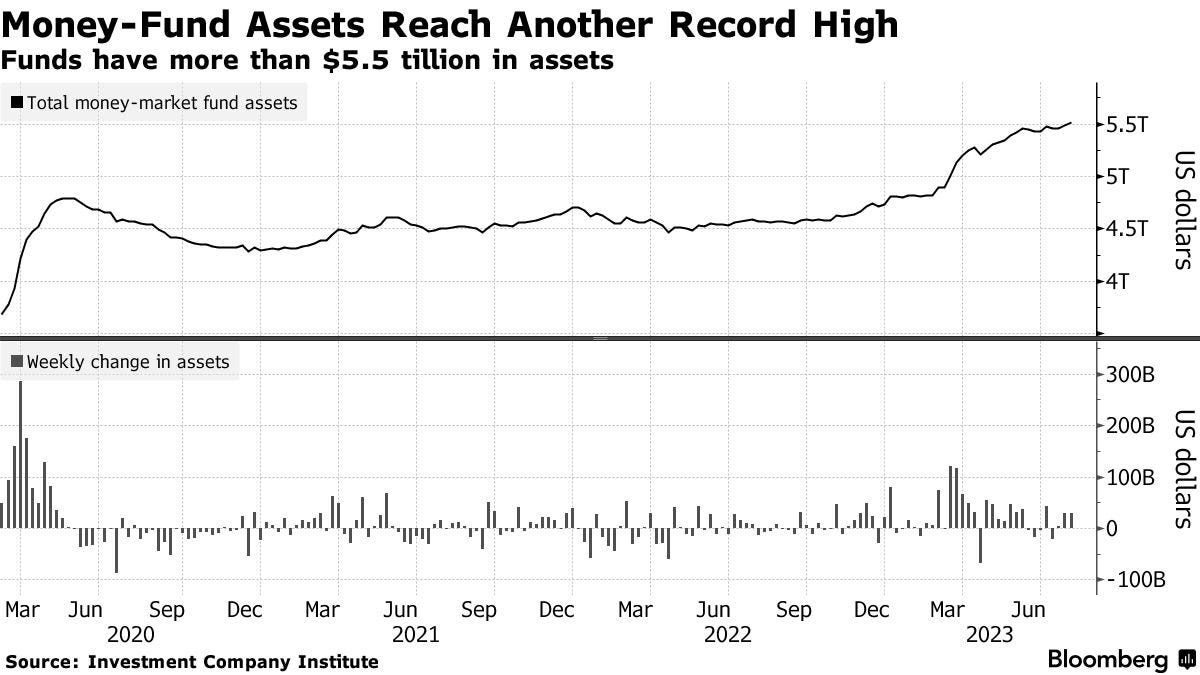
US money-market fund assets reached a new high, with about $29 billion flowing in during the week through August 2, leading to a total of $5.52 trillion in assets. This surge in investment is a result of interest rates exceeding 5%, which has attracted cash from banks and other short-term investments.
Macro Chart In Focus
Analyst Team Note:
The current pullback in corporate demand for buybacks will diminish a significant source of buying power when the market's momentum is already slowing down. This decline signals a potential shift in emphasis towards capital investing, contrasting with the post-2008 financial crisis period when cheap, debt-fueled buybacks and a stagnant economy made new investment projects unappealing. After 2008, companies allocated only 38 cents to capex for each dollar generated or borrowed, compared to 54 cents before the crisis, and the allocation for buybacks increased to 24 cents from 13 cents, per BofA.
This potential shift in investment strategy could drastically change the economic landscape if it persists, moving away from the era of debt-funded buybacks towards an era of increased capital investment.
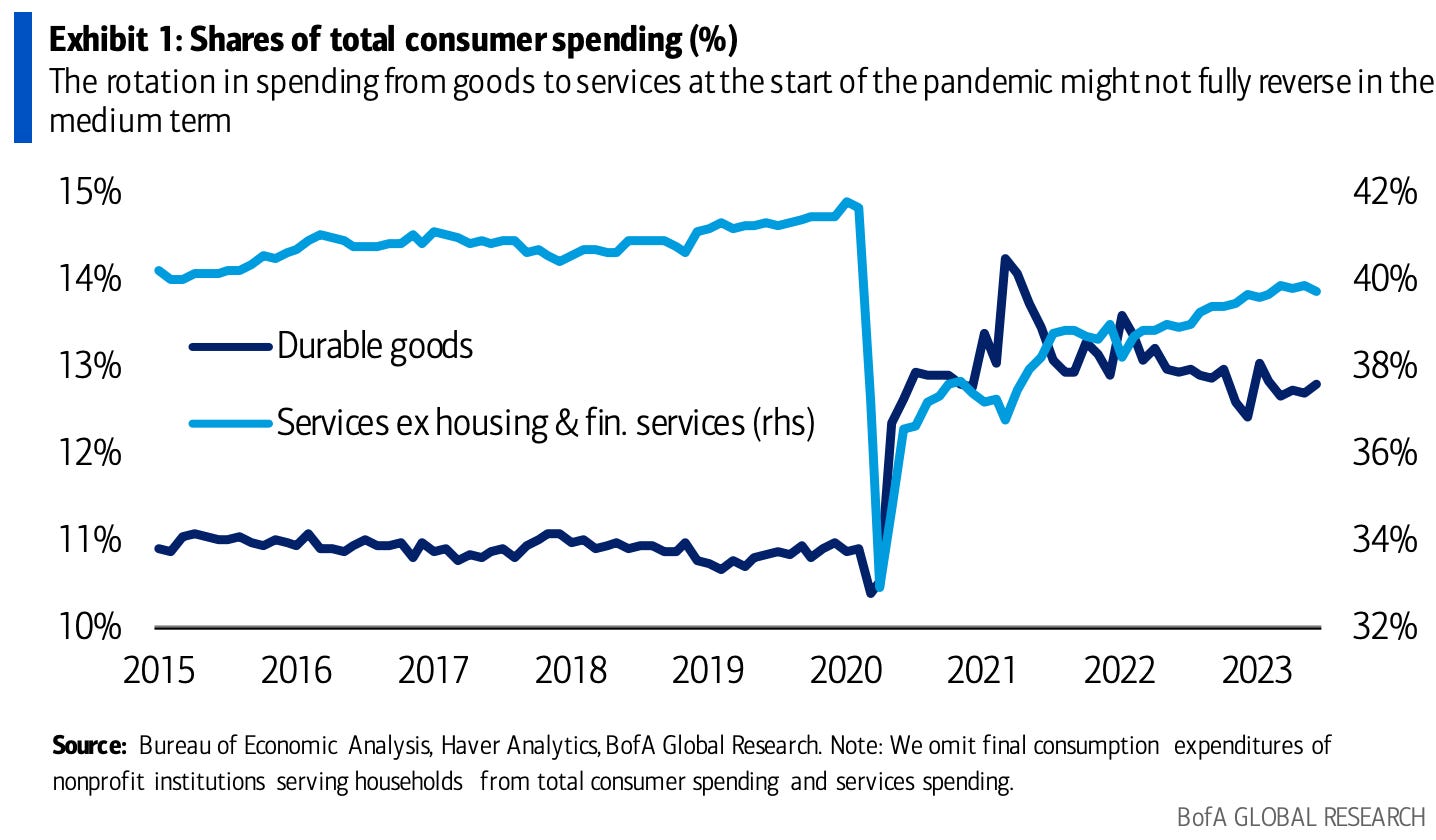
The resilience exhibited by US consumers this year has primarily been fueled by a strong surge in spending on durable goods, while services disrupted by the pandemic have slowed down after a sharp recovery in 2021. The shift in spending patterns seems to have stabilized with a slight dip in services expenditure and a corresponding rise in durable goods spending. This shift in consumer behavior is expected to persist due to the rise in remote or hybrid work arrangements, as such setups change traditional spending patterns by reducing demand for work-from-office services and increasing demand for home office-related durable goods.
Chart That Caught Our Eye
Analyst Team Note:
Priced at less than 11x forward one-year earnings, the MSCI China Index is below its five-year average multiple of over 12 times. It’s valued at a 14% discount versus the MSCI Emerging Markets Index, compared with the average 4% discount since 2010.
Sentiment Check
Make sure to check Larry’s most recent market updates via his personal newsletter.