

8.10.22: Inflation Data Gives Markets a Short-Term Reason To Celebrate
Key U.S. and China brief market notes by Larry's Analyst Staff Team.


Note to Readers: Our core belief at this moment is that the markets will make a violent turn once the current rally drives out all new bears in the market. The current campaign to drive out short-sellers will encourage new bulls to enter the market. There may be a time in the future where BOTH bulls and bears get disappointed.
We remain convinced this is a short-covering rally and not a rally based on organic demand. Careful stock selection and selective theme positioning is likely to work better than pure index ETFs with the S&P 500 now at ~4200. An example is our opinion on Meta vs. the S&P 500 (see bottom of this email). We will discuss today’s Inflation print inside our Community by our mid-month update, and how to evaluate risk/reward going forward.
If the Fed pivots based on today’s inflation print, we believe they will be unable to control inflation as it stays entrenched. This will lead to bigger problems down the road, and would strengthen a longer-term bearish stance on first the real economy, followed by the Stock Market later.
This email is brought to you by Interactive Brokers, one of our preferred brokerages to buy HK-Listed Shares in our China Internet Equity Coverage Universe.
In our emails, we will provide the following coverage points:
Brief Snapshot of U.S. & China markets and valuation
Our Analyst Team’s Chart in Focus
U.S. & China Upcoming Economic Calendar Snapshot
Notable Chart from Media Outlets
Fear & Greed Index Recap
I hope you find this newsletter to be insightful and enjoyable! - Larry and Team
U.S and China Markets Brief Snapshot 🇺🇸 🇨🇳
(Powered by our Channel Financial Data Provider YCharts)
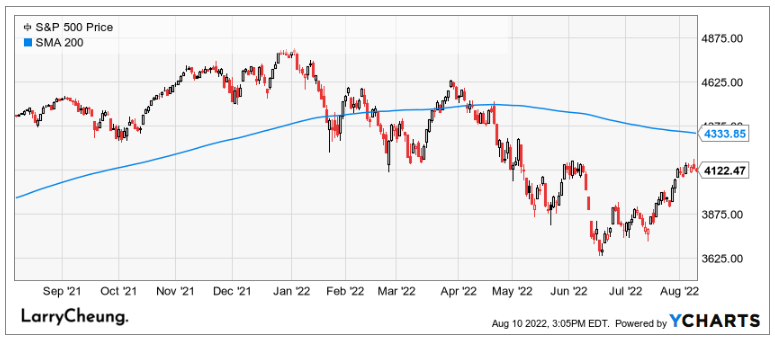
S&P 500 Index: 4122.47
KWEB (Chinese Internet) ETF: $27.76

Analyst Team Note:
Here are some levels for the SPX to watch:
Resistance: 4308 (weekly reversal highs from late April and early May), which is aligned with the declining 40-week MA near 4307.
Supports: 3721 (mid July low) and 3636 (June YTD low)
200-week MA and 50% retracement of the gains from March 2020 to January 2022 rally both lie in the 3500 to 3547 range.
Source: Bank of America
Macro Chart In Focus

Analyst Team Note:
While the -4.6% MoM change in Energy was encouraging, the price of food increased by the largest since 1979… Cost of shelter up 0.54% MoM…
Do not let the flat MoM change in CPI and the media/political narrative fool you.
The “true necessities” (food and shelter) haven’t shown signs of slowdown.
In addition, BofA found that overall real disposable personal income dropped the most in the first-half ever and four times more than its largest previous decline during the 1974 recession.
Inflation is elevated and with risk appetite coming back due to a 8.5% CPI print, this comes at odds with the sharp adjustments necessary to bring U.S. demand into better balance with supply in order for inflation to return to the Federal Reserve’s (Fed) 2% target.
Throw on the “Inflation Reduction Act” and continued attempts by the government to lower the pain of inflation…. Econ 101 question: What happens when you subsidize demand but supply remains constant?
Source: Bank of America
Upcoming Economic Calendar
(Powered by our Channel Financial Data Provider YCharts)
U.S Economic Calendar (Upcoming Data Points)

China Economic Calendar (Upcoming Data Points)

Analyst Team Note:
Came across some fascinating data this past week…
Since March, companies have added 1.68 million jobs on payroll… BUT, the number of people employed since March has declined by 168k…
So what’s happening here?
Since March, the total number of multiple jobholders has increased by 263k. Even crazier, we have the largest amount of people ever that are working two full-time jobs.
Since there’s almost two job openings for every unemployed person right now, this explains why so many people could have two full-time jobs. The problem is that while the number of job openings are still at historic highs, we’re starting to see record declines in job openings.
Pay attention to these metrics over the months to come…
Sources: BLS, St. Louis Fed, ZeroHedge
Chart That Caught Our Eye

Analyst Team Note:
While large cap valuations are still elevated realtive to historical data, small caps have fully re-rated to lows not seen since the 2008 GFC.
BofA notes that “Small cap Financials, Energy, and Discretionary screen as broadly the most inexpensive. Small cap Tech, Staples, and Utilities screen as broadly the most expensive.”
Sentiment Check

We want to take a moment to thank Interactive Brokers for being one of our Channel’s trusted Partners and to inform my audience of the special features they have given that our online friends here closely follow Chinese Internet stocks (BABA/Tencent).

Much of Larry’s audience is concerned about the US ADR issue of Chinese Stocks being delisted.
Interactive brokers allows investors to buy HK-listed shares of Alibaba, JD, Tencent, and other brand name Chinese Internet companies on the HK market. This will effectively reduce any confusion or work you will have to do in case there is the event of delisting US ADRs
From our friends inside - taking advantage of Meta’s status as one of “deep value” opinions. Meta has soared from 160/share to 178/share today since our opinion was shared.
