Note to Readers from Larry: I hope the Community is well rested after the July 4th holiday long weekend! I am determined to help you have a great 2nd half of the year.
Follow me on Instagram Meta Threads as I’ll try out this platform to see what it’s like compared to Twitter: https://www.threads.net/@larrycheungcfa
Key Investing Resource: Strategist Larry uses Interactive Brokers as his core brokerage. Feel free to check out IB. I currently park excess cash (yielding 4.5%+ on idle cash) at Interactive Brokers
In our emails, we will provide the following coverage points:
In June, the Sell Side Indicator (SSI), which measures US sell side strategists' average recommended allocation to stocks, rose by 33 basis points to 52.9%, marking the largest monthly increase since November 2022. This increase came as the S&P 500 rallied by 6.5%, effectively ending the bear market.
However, the sentiment remains bearish, which is seen as a bullish signal according to the contrarian model. The current SSI level suggests a +16% price return over the next 12 months, signaling a potential S&P 500 level of 4800 by year-end or 5200 in 12 months.
Despite the S&P 500's impressive 16% rally in the first half of the year - the best first half since 2019 - the SSI only moved slightly, and is now 16 basis points lower than it was at the start of the year. This starkly contrasts the 5.1 percentage point drop seen in the first half of 2022 when the S&P 500 fell 21%.
Strategists appear reluctant to adjust allocations given mixed macroeconomic signals, resulting in an average SSI movement of only 15 basis points per month this year, compared to an average of 85 basis points per month in the first half of 2022. The report suggests that, while some investors have recently become more bullish due to AI developments, there is a broader case to be made for stocks.
Macro Chart In Focus
Analyst Team Note:
Apple made history on Friday, becoming the first company to reach a market capitalization of $3 trillion. This milestone comes after a difficult 2022 for the tech sector, with Apple seeing significant losses. However, the company has rebounded strongly in 2023, with its share price increasing by 49%, contributing to a rise of over $900 billion in its market capitalization. Despite much of this year's tech rally being fueled by excitement around AI, Apple has been notably reticent about the technology in its earnings releases, instead focusing on its new mixed-reality headset, the Apple Vision Pro. This achievement marks Apple's remarkable growth from a measily $5-billion company in 2000 to a global powerhouse over the past 23 years.
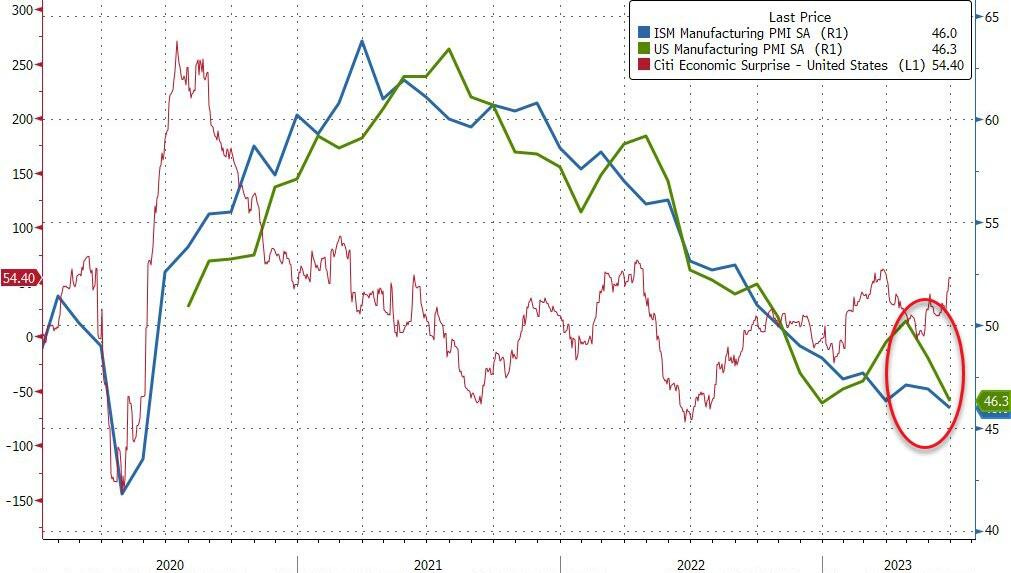
The US Manufacturing sector is in a deep contraction, despite the recent resurgence in upside surprises for US macro data. Both the Institute for Supply Management (ISM) and the Purchasing Managers Index (PMI) surveys indicate this downturn, with the ISM Manufacturing reading dropping to 46.0 in June, a significant miss from the expected 47.2.
The drop is attributed to a severe decline in demand for goods, lower employment, new orders, and a significant decrease in prices paid. Factors contributing to this situation include higher living costs, increased interest rates, and growing economic uncertainty, which are causing customers to curb spending.
Chart That Caught Our Eye
Analyst Team Note:
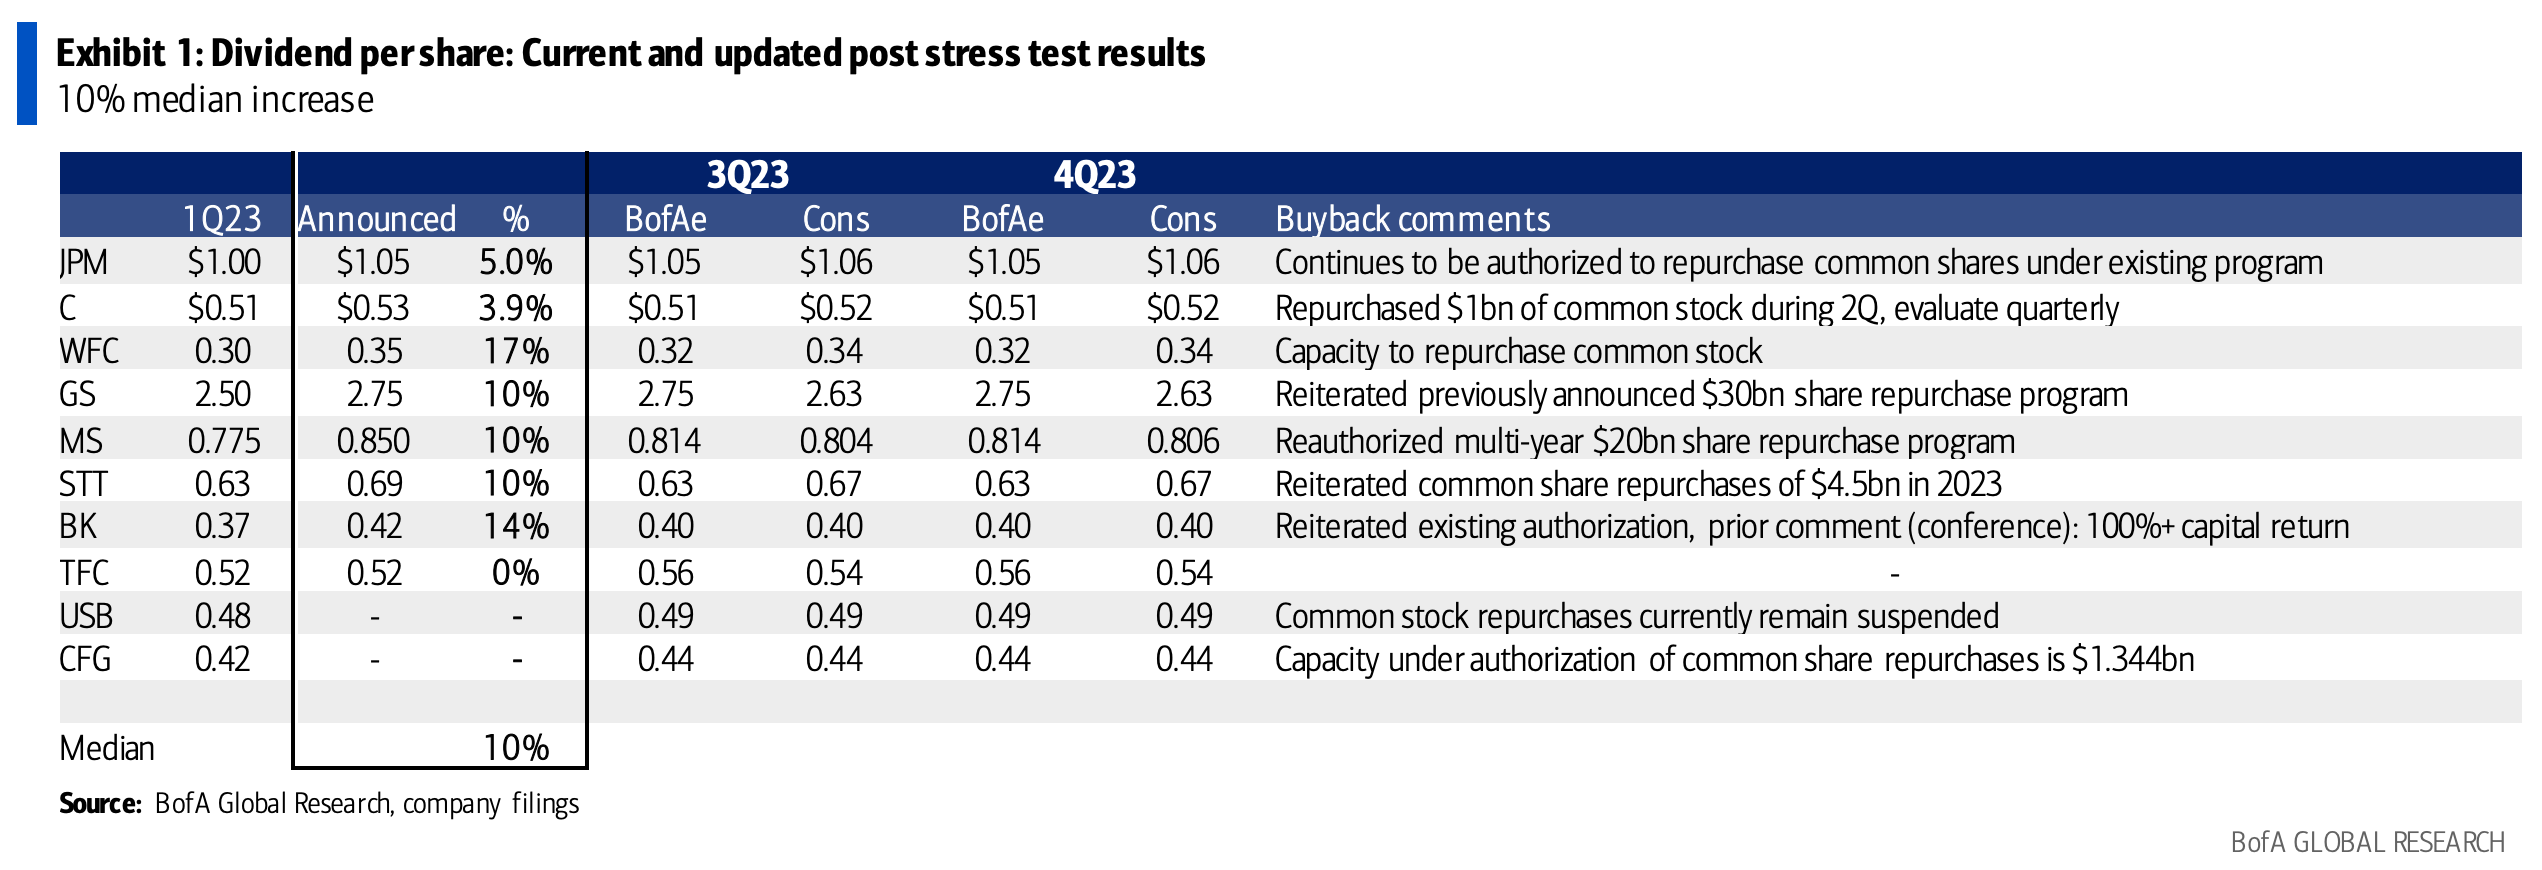
Following the Federal Reserve's stress test, banks on average announced a 10% increase in their quarterly dividend per share, reinforcing the industry's financial strength.
Sentiment Check
Make sure to check Larry’s most recent market updates via his personal newsletter.