Note to Readers: This is a concise email newsletter format sent as part of Larry’s Investment Analyst Team communications to his public audience. To read his personal opinions, please read his separate public letters here. This email is designed to be primarily data-driven and will be sent out on Mondays/Wednesdays/Fridays. More qualitative commentary along with our actionable conclusions is provided inside our Investment Community.
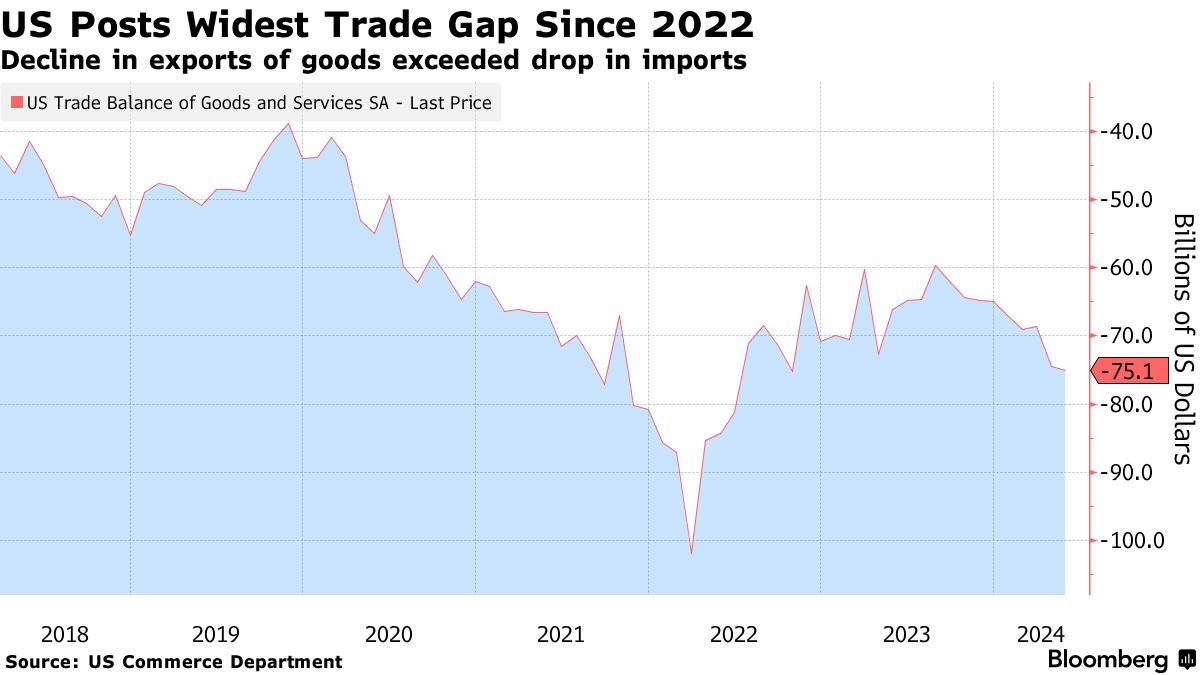
The U.S. trade deficit widened to $75.1 billion in May 2024, the largest since October 2022, as exports declined more than imports.
The widening deficit is expected to negatively impact second-quarter GDP growth.
Exports of goods dropped to their lowest level since November, driven by declines in industrial supplies, aircraft, and automobiles. Factors contributing to this include limited economic growth overseas and a strong U.S. dollar.
On the import side, cooling consumer spending and increased retail inventories may continue to dampen demand for foreign goods. Notable changes include record-high services exports and imports, increased travel exports, and widening trade deficits with China and Mexico.
The U.S. services sector experienced a significant contraction in June, with the Institute for Supply Management's (ISM) composite gauge of services dropping 5 points to 48.8, the lowest level in four years.
This decline was driven by a sharp pullback in business activity and declining orders, with the business activity index plunging 11.6 points and new orders shrinking for the first time since late 2022.
Eight out of 18 services industries reported contraction, including real estate, mining, and retail trade.
We want to take a moment to thank Interactive Brokers for being one of our Channel’s trusted Partners and to inform my audience of the special features they have given that our online friends here closely follow Chinese Internet stocks (BABA/Tencent).
Much of Larry’s audience is concerned about the US ADR issue of Chinese Stocks being delisted.