7.19.23: Earnings Season will stress test the market's current valuation levels
For Public Readers: Weekly Key U.S. and China brief market notes by Larry Cheung's Analyst Staff Team for our Public Email List

Note to Readers from Larry: As discussed in my premium weekend note (July Technical Analysis edition), as long as the market trades above certain key levels, I have no choice but to give the uptrend the benefit of the doubt.
My macro view strongly disagrees with the market’s pricing, but my technical view forces me to stay constructive (for now).
I am on maximum caution mode, and my research notes to Members will reflect this.
My previous ideas of CF Industries/Mosaic, RSP ETF Equal Weight, and Oil are standing firm.
At this juncture, I do not have a clear view on broad index direction but will look for sector rotation ideas when they appear.
Key Investing Resource: Strategist Larry uses Interactive Brokers as his core brokerage. Feel free to check out IB. I currently park excess cash (yielding 4.5%+ on idle cash) at Interactive Brokers. Check it out. It’s a great brokerage.
In our emails, we will provide the following coverage points:
Brief Overview of U.S. & China Markets
Macro Chart in Focus
U.S. & China Upcoming Economic Calendar
Chart That Caught Our Eye
U.S and China Markets Brief Snapshot 🇺🇸 🇨🇳
(Powered by our Channel Financial Data Provider YCharts)
S&P 500 Index: 4554.98
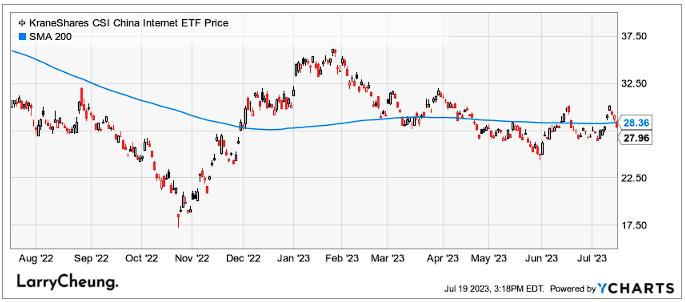
KWEB (Chinese Internet) ETF: $27.96
Analyst Team Note:
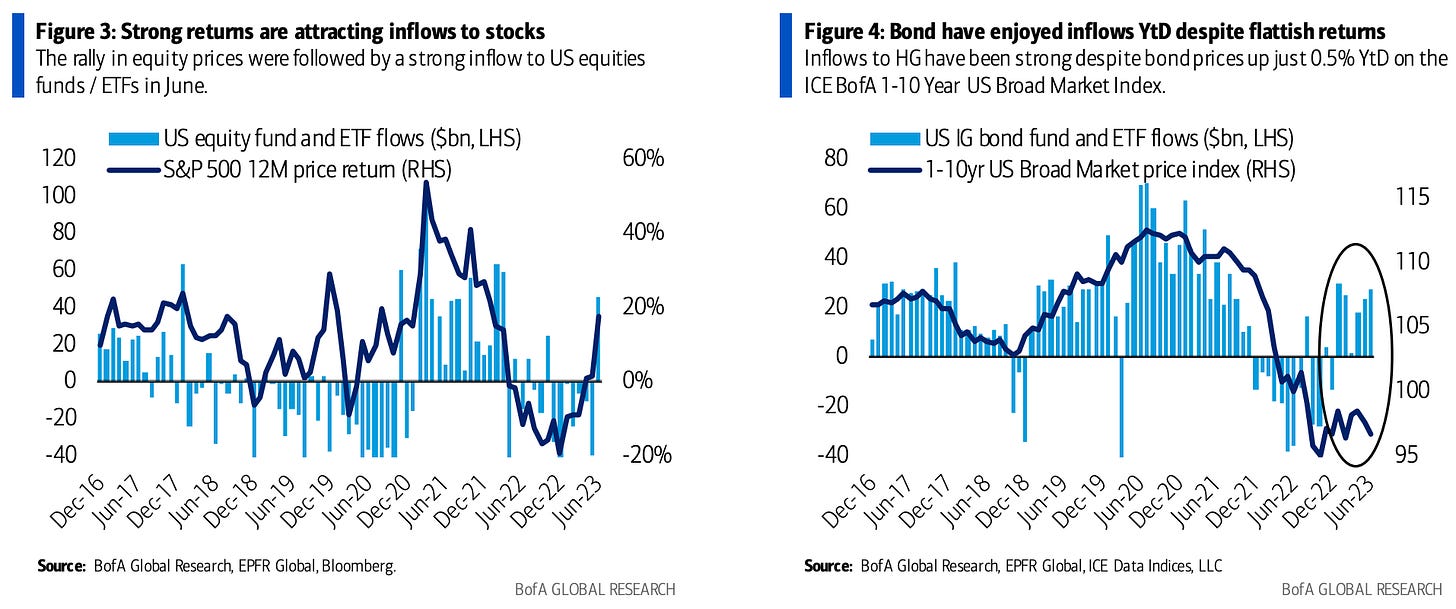
Since April month-end, the S&P 500 has rallied 9%, attracting $45bn worth of inflows in June into equity funds / ETFs. This was the biggest flow since March 2022 and the first inflow since October 2022. Even though flows typically follow returns, big inflows to bonds have remained resilient despite lackluster bond returns.
Macro Chart In Focus
Analyst Team Note:
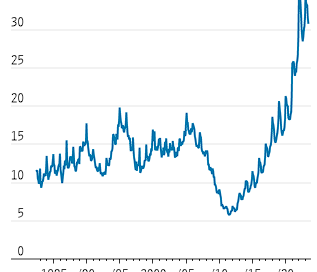
The depreciation of the dollar coupled with early indications of global economic recovery are suggesting an increase in both U.S. and international earnings growth, providing a boost to equities. However, as the U.S. earnings season commences, the aggregate yearly EPS growth for the S&P continues to decline.
This development coincides with the initial signs of global growth rebound. As a small, open economy and significant producer of semiconductors, which is a highly cyclical product, Taiwan is extremely reactive to changes in the global economy. The fluctuations in Taiwan's export growth usually precede global EPS growth.
Upcoming Economic Calendar
(Powered by our Channel Financial Data Provider YCharts)
U.S Economic Calendar (Upcoming Data Points)
China Economic Calendar (Upcoming Data Points)
Analyst Team Note:
The sudden surge in mortgage rates last year led to a significant decline in demand for new homes. However, the market surprisingly picked up again by May, and despite stable mortgage rates, the sales for all home builders achieved their highest level since early 2022. The scarcity of existing homes on the market has resulted in an increasing reliance on new constructions, which accounted for nearly one-third of all single-family homes for sale nationwide in May.
The revival of home building and the financial incentives offered by builders have only provided minor relief to potential buyers due to the ongoing shortage of existing homes. Home prices have slightly declined from their record highs in Spring 2022, but competition remains fierce with prospective buyers often engaging in bidding wars.
Despite these challenges, home builder confidence has improved considerably, reaching its highest level since June 2022. Investors have also shown increased faith in the home-building industry, which has demonstrated stronger-than-expected performance this year. Amid these circumstances, builders are focusing on constructing smaller, more affordable homes and offering financial incentives to attract buyers.
Chart That Caught Our Eye
Analyst Team Note:
The U.S. office sector has emerged as the leading contributor to distressed commercial real estate, outpacing previous leaders such as hotels and retail properties, according to a report from MSCI. At the end of Q2, the value of troubled office buildings stood at $24.8 billion, up 36% from the first quarter, surpassing the $22.7 billion in distressed retail properties and $13.5 billion in troubled hotels. This shift is the first since 2018 that the office sector has topped distressed properties, fueled by weak demand due to the rise of remote work and other challenges like delinquent loan payments and high vacancies.
The situation is predicted to worsen for offices, with MSCI identifying an additional $162 billion of properties potentially in distress. The remote work trend has left about 20% of U.S. office space vacant as of June 30. An estimated $189 billion of debt on office buildings is due to mature in 2023, with an additional $117 billion due in 2024, as per the Mortgage Bankers Association.
Sentiment Check
Make sure to check Larry’s most recent market updates via his personal newsletter.


