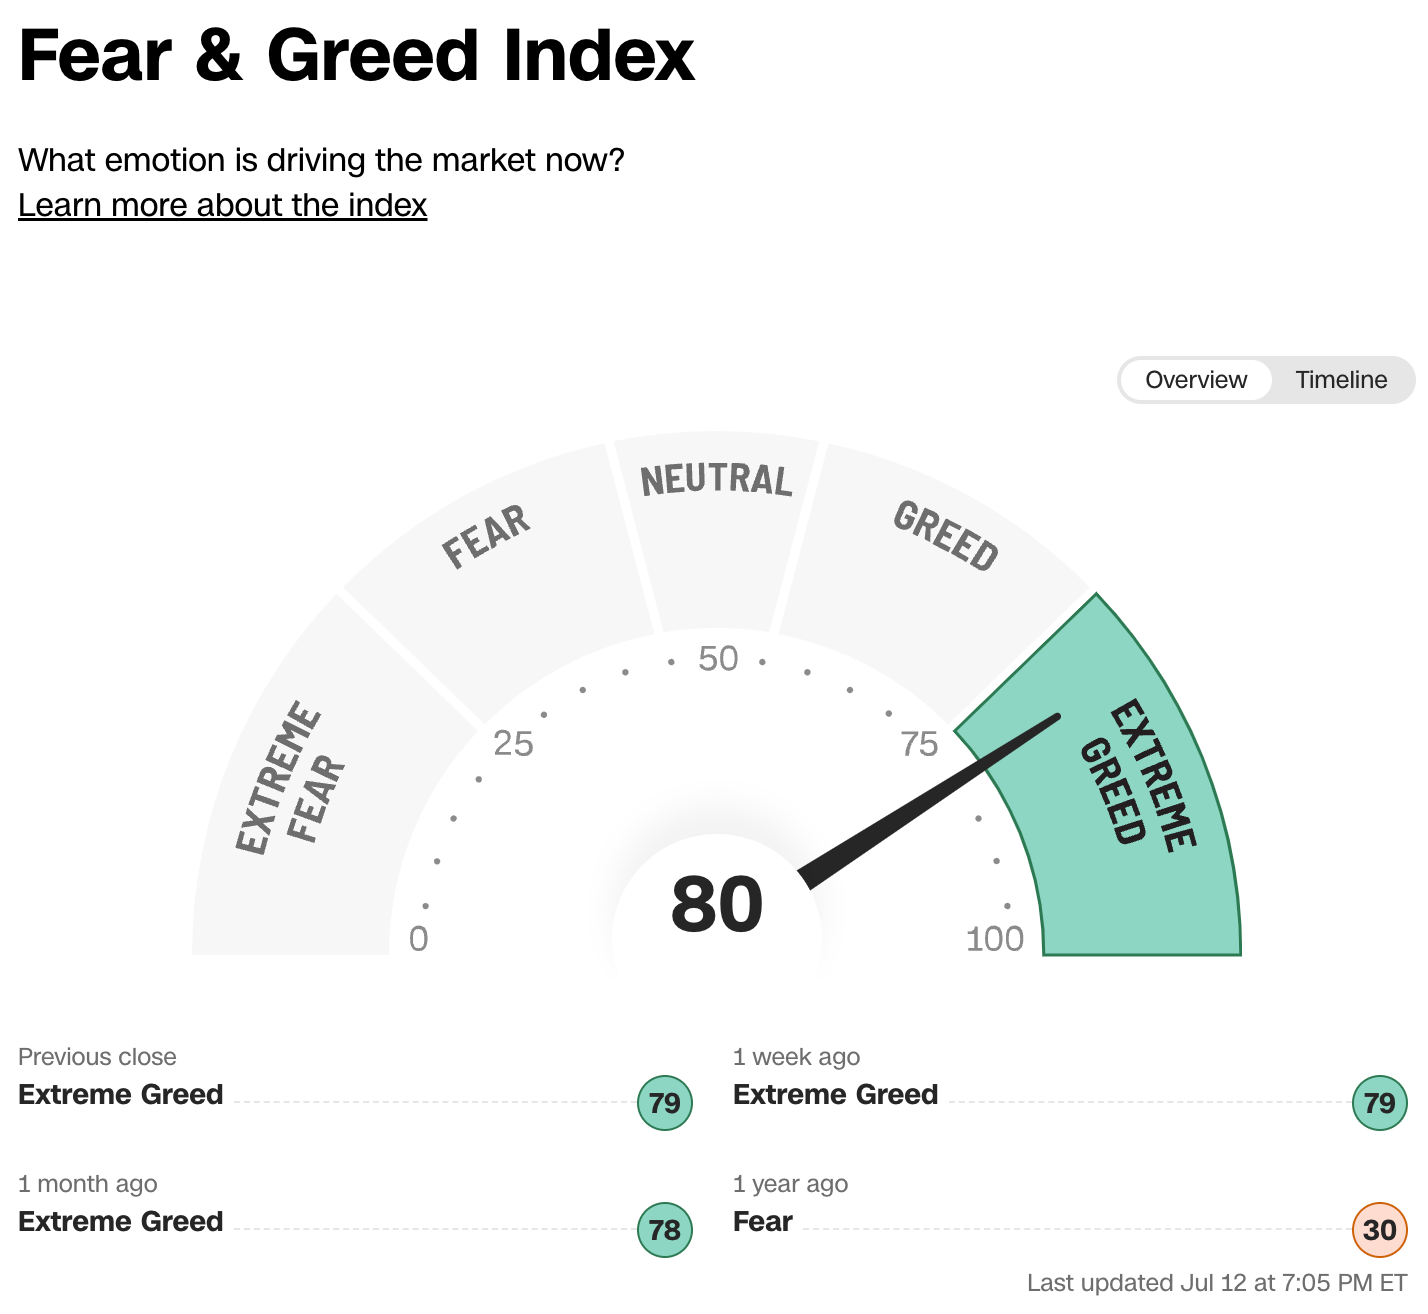
7.12.23: Markets pressure Bears to capitulate as we break multi-week resistance on upside as Inflation decelerates down to 3%
For Public Readers: Weekly Key U.S. and China brief market notes by Larry Cheung's Analyst Staff Team for our Public Email List

Note to Readers from Larry: This market has been (and will continue to) rewarding nimble traders who have been willing to switch positioning to ride the underlying trend. This upside rally has been rewarding for my positioning.
However- I am utterly convinced that the worst is yet to come for many different asset classes.
Once I can detect that Bears fully capitulate, the end of this rally will be near. I will share observations to members once I see any data that suggests this to be the case.
Bears are still fighting this rally, and that means it may not be over. I surmise that the market advance is not due to organic buying, but due to “buy-to-cover” orders from Shorts who have to close positions.
One asset class which I am outright bearish on is the housing sector. I believe that first time homebuyers (non-all-cash buyers) who enter the housing market at this pricing juncture are entering at the wrong time.
Key Investing Resource: Strategist Larry uses Interactive Brokers as his core brokerage. Feel free to check out IB. I currently park excess cash (yielding 4.5%+ on idle cash) at Interactive Brokers. Check it out. It’s a great brokerage.
In our emails, we will provide the following coverage points:
Brief Overview of U.S. & China Markets
Macro Chart in Focus
U.S. & China Upcoming Economic Calendar
Chart That Caught Our Eye
U.S and China Markets Brief Snapshot 🇺🇸 🇨🇳
(Powered by our Channel Financial Data Provider YCharts)
S&P 500 Index: 4439.26
KWEB (Chinese Internet) ETF: 27.93
Analyst Team Note:
The first half of 2023 saw a strong performance from equity markets, a stark contrast to the historic selloff in 2022. Last year, the S&P 500 experienced a peak-to-trough decline of 25% between January and October, the fourth largest drop outside of recessions in the post-WWII era, only outdone by the bear markets of 1947, 1962, and 1987. Despite this steep decline, bond markets saw an even greater valuation drop due to a sharp rise in interest rates.
As a result, the S&P 500's valuation increased by 175 basis points on an earnings yield basis, though this was less than the 225 basis points rise in the 10-year Treasury yield, suggesting a relative valuation decrease for equities.
This year has seen a double-digit increase for equity markets alongside stable bond yields, narrowing the valuation gap between equities and fixed income. This resurgence in equity markets, following a historically significant decline in 2022, highlights the potential for a continued rally.
Macro Chart In Focus
Analyst Team Note:
US inflation decreased to 3% last month, marking a more than two-year low and one-third of the level reached a year ago, which was a four-decade high. This reduction, alongside other key measures of underlying inflation coming in below forecasts, has sparked anticipation that the Federal Reserve might ease up on its historic monetary tightening.
Shelter costs, the largest services component of the CPI index, increased by 0.4%, the smallest increase in a key measure of rent since late 2021, and economists anticipate further easing in housing price gains in the coming months. However, goods prices excluding food and energy fell for the first time in 2023, while grocery and medical care service costs remained stable. Airfares and hotel stays fell 8.1% and 2% respectively, energy prices rose primarily due to gasoline and electricity, used car prices fell for the first time in three months, car insurance costs continued to rise, and shelter costs contributed to over 70% of the total monthly advance.
Upcoming Economic Calendar
(Powered by our Channel Financial Data Provider YCharts)
U.S Economic Calendar (Upcoming Data Points)
China Economic Calendar (Upcoming Data Points)
Analyst Team Note:
The Swiss franc and Japanese yen gained strength against the dollar, reaching their highest levels since 2015. The euro and British pound also surged reaching their highest levels in over a year. This downward shift in the US dollar is attributed to the general view that the Fed's tightening cycle is nearing its end.
Chart That Caught Our Eye
Analyst Team Note:
Meta's text-based app rival to Twitter, Threads, reached 100 million downloads just over 100 hours after its official launch. This rapid growth has been attributed to its seamless integration with Instagram, allowing the platform's 2 billion users to easily link their accounts to Threads. In comparison, it took Instagram 2.5 years and TikTok 9 months to reach the same milestone.
In response to Threads' success, Twitter's owner Elon Musk threatened legal action, claiming that Meta poached Twitter employees and used confidential information to develop the app. Meta denied these allegations but has a history of borrowing elements from competitors. Despite resembling Twitter in layout, Threads is more mobile-focused and does not use hashtags. The future of Threads will depend on whether its initial users choose to stay.
Sentiment Check
Make sure to check Larry’s most recent market updates via his personal newsletter.


