6.30.23: Bulls have seized the U.S. Market Narrative in 1H 2023. What happens next?
For Public Readers: Weekly Key U.S. and China brief market notes by Larry Cheung's Analyst Staff Team for our Public Email List

Note to Readers from Larry: I sincerely hope the folks had a great 1H 2023, and are looking forward to the 2H 2023 investment landscape.
This game is not for the feign of heart, and people who put in the time, effort, and preparation will ultimately have an edge.
Whether you are a passive index investor or an active trader, one thing is for sure: the 2nd half of this year will simultaneously provide rewards and create frustration for all types of market participants.
Make sure to follow me on Instagram and Twitter for periodic commentary on various topics (markets, life perspectives, short vlogs).
Most importantly, I hope you have a great 4th of July!
Key Investing Resource: Strategist Larry uses Interactive Brokers as his core brokerage. Feel free to check out IB. I currently park excess cash (yielding 4.5%+ on idle cash) at Interactive Brokers
In our emails, we will provide the following coverage points:
Brief Overview of U.S. & China Markets
Macro Chart in Focus
U.S. & China Upcoming Economic Calendar
Chart That Caught Our Eye
U.S and China Markets Brief Snapshot 🇺🇸 🇨🇳
(Powered by our Channel Financial Data Provider YCharts)
S&P 500 Index: 4396.33
KWEB (Chinese Internet) ETF: 26.83
Analyst Team Note:
Hopes of extending Q2's market rally are being met with skepticism due to high valuations, particularly with the S&P 500 trading at a valuation of 19x 12-month forward earnings and an overhyped AI market. As of now, the S&P 500 index is above the average year-end price target of 4,100 at 4,400.. Remarkably, five stocks constitute nearly a quarter of the index's total market capitalization, the most concentrated since the 1970s. Despite AI being the primary driver of the index's increase, it's worth noting that all sectors in the S&P 500 advanced in June.
On the other hand, while stocks continue to gain, risks are also rising and profits are under pressure with more economic vulnerabilities surfacing. The upcoming earnings season is expected to see a 6.5% YoY contraction in S&P 500 earnings, marking the third consecutive quarter of decline, and potentially the worst earnings quarter since the pandemic.
The New York Fed's recession indicator, largely based on the yield curve, currently shows a 70% likelihood of a recession within the next year. However, there are usually long and variable lags between these signals and the actual onset of a recession.
Macro Chart In Focus
Analyst Team Note:
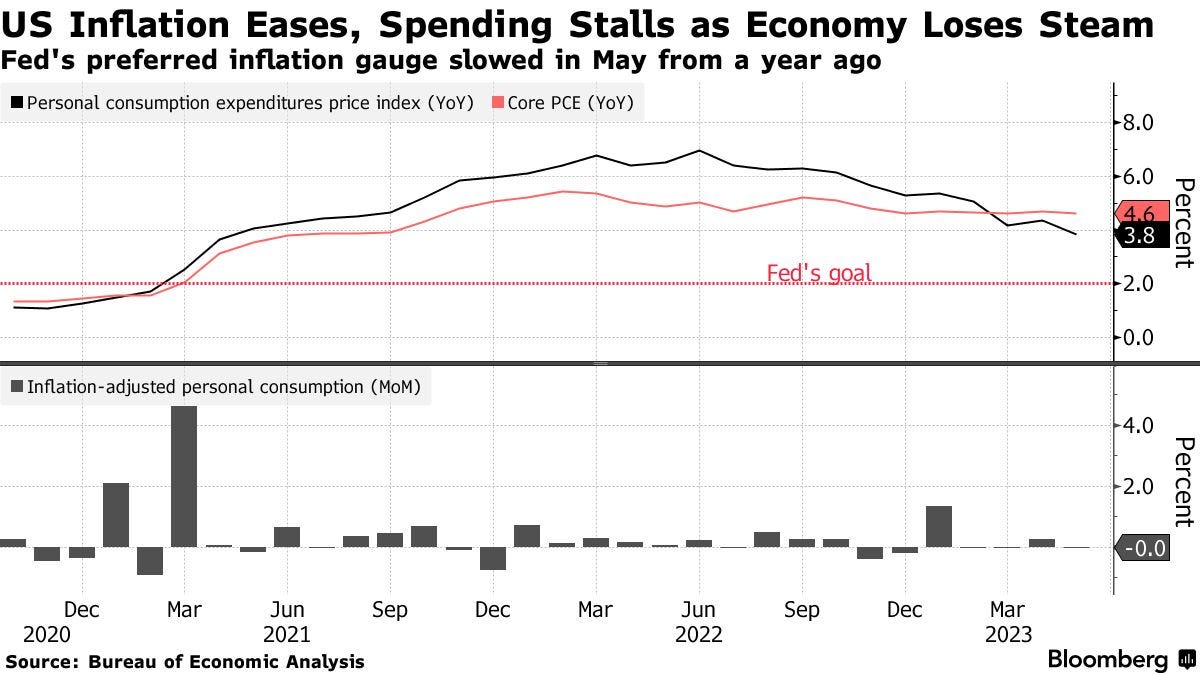
The Federal Reserve's favored measure of US inflation (PCE) showed a slowdown in May while consumer spending remained flat, signaling a loss of momentum for the economy. The PCE rose only 0.1% in May, and the annual increase marked the slowest pace in over two years.
Conversely, consumer spending, adjusted for inflation, barely changed following a gain of 0.2% in April, marking a stagnation of household spending after an early-year surge. While spending on goods declined, service-related expenditures increased.
Excluding food and energy costs, the core PCE price index rose 4.6% year-on-year, consistent with readings since late 2022, indicating continued high price pressures. Despite this, a key inflation metric highlighted by Fed Chair Jerome Powell - services inflation excluding housing and energy services - saw a smaller advance, rising only 0.2% in May from the previous month. This was its smallest increase since July of the previous year.
Upcoming Economic Calendar
(Powered by our Channel Financial Data Provider YCharts)
U.S Economic Calendar (Upcoming Data Points)
China Economic Calendar (Upcoming Data Points)
N/A
Analyst Team Note:
The U.S. federal budget deficit has grown considerably over the past year, reaching a total of $2.1 trillion, an increase of 50% from the $1.4 trillion deficit recorded in Fiscal Year 2022. This current deficit is more than twice as large as the deficit before the onset of the pandemic.
The budget deficit amounts to around 8% of the estimated GDP, marking the largest deficit in the past 60 years outside of times of war or recession.
Chart That Caught Our Eye
Analyst Team Note:
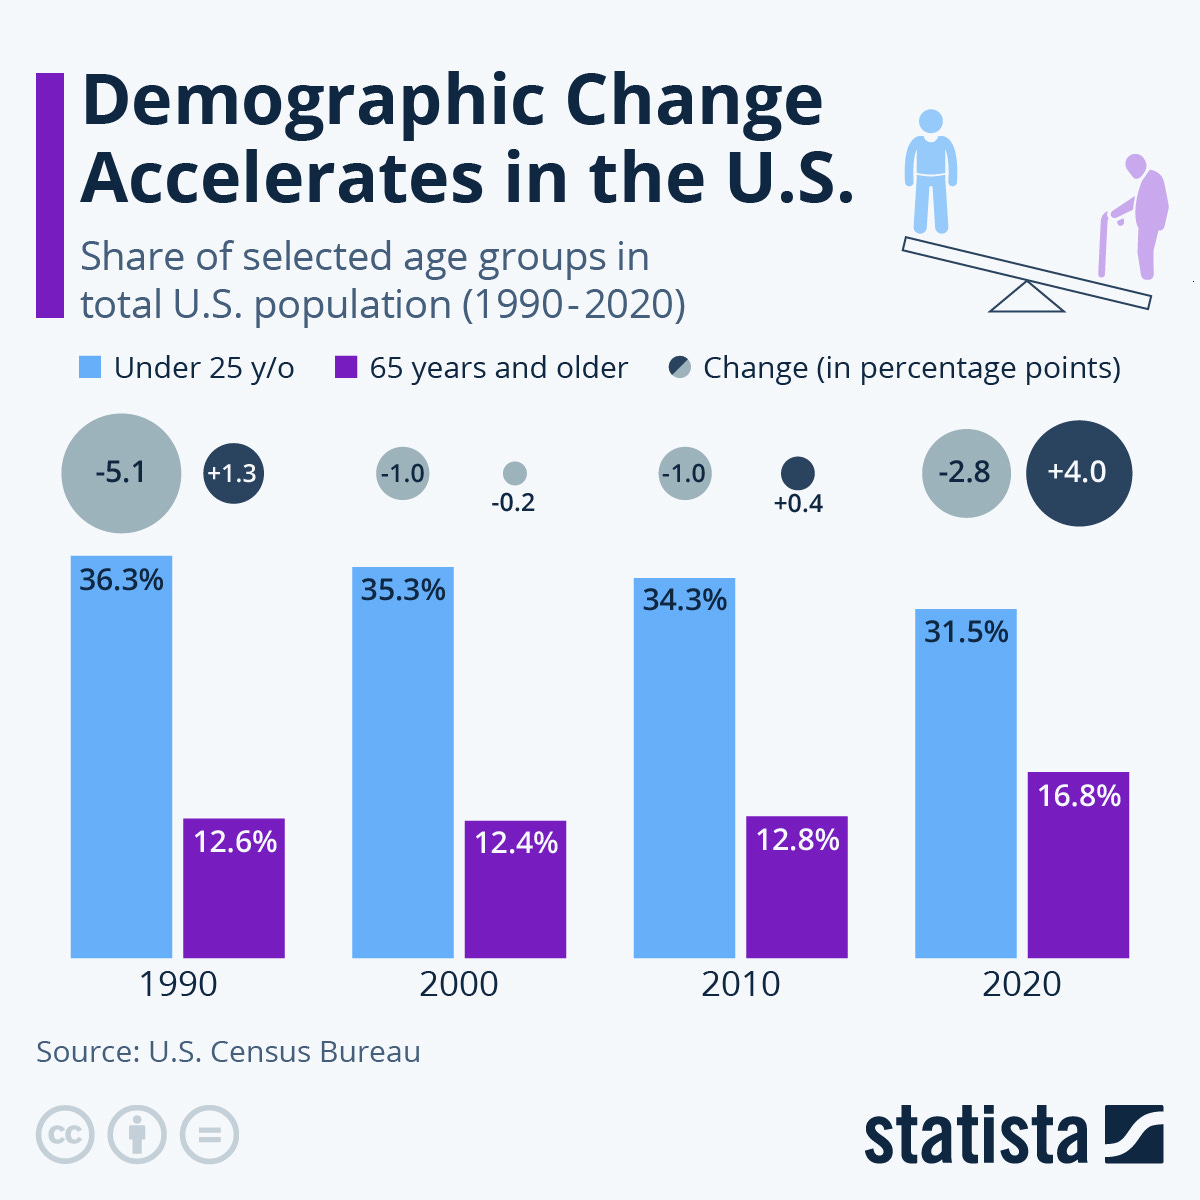
Recent data from the 2020 Census indicates that demographic change in the United States has accelerated in the past decade, with the group of Americans aged 65 and older growing significantly. The proportion of this age group has increased from 12.8% in 2010 to 16.8% in 2020, an increase of 4%.
Conversely, the share of Americans under 25 years old declined more than usual, dropping by 2.8 percentage points to 31.5% of the population. Although such demographic shifts are not unprecedented in the U.S., these changes point to a society that is growing older, a trend which is even more pronounced in countries like Japan, where 28.5% of residents were 65 or older in 2020.
Sentiment Check
Make sure to check Larry’s most recent market updates via his personal newsletter.


