Make sure to check out Interactive Brokers above as idle cash now will yield more than 4.5% as the Fed just raised rates.
Key Investing Resource: Strategist Larry uses Interactive Brokers as his core brokerage. Feel free to check out IB. I currently park excess cash at Interactive Brokers. Check it out. It’s a great brokerage.
In our emails, we will provide the following coverage points:
BlackRock's iShares 20+ Year Treasury Bond ETF (TLT) experienced a record-breaking inflow of $2.7 billion on Monday, marking its largest single-day inflow since its inception in 2002.
The significant inflow comes as investors recalibrate their expectations for Federal Reserve interest rate cuts, with some traders betting on 3 percentage points of cuts over the next nine months as economic growth slows.
Macro Chart In Focus
Analyst Team Note:
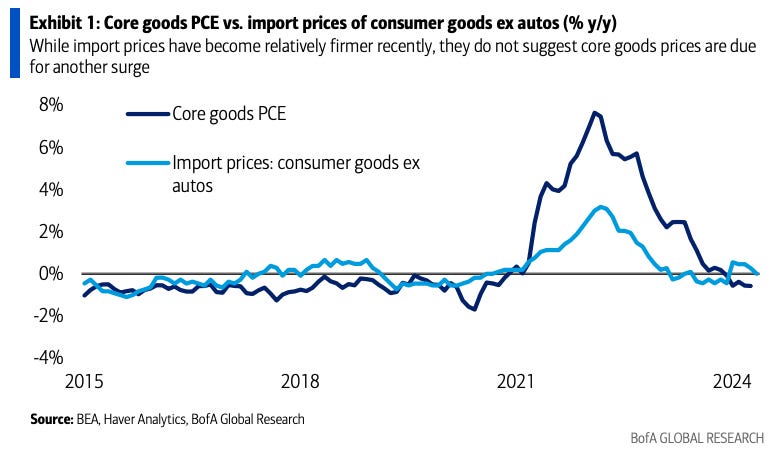
The recent surge in shipping costs, with freight indices rising over 20% since late May, has raised concerns about potential inflationary pressures.
This increase is attributed to geopolitical tensions in the Middle East forcing longer shipping routes, port congestion, container shortages, and increased demand partly due to tariff concerns
Today's softer goods demand and adequate supply make it more challenging for firms to pass on higher costs to consumers, potentially leading to compressed margins rather than widespread price increases.
The US housing market, which had shown signs of stabilization in 2023, is experiencing renewed downturns in 2024.
Recent data from the US Census Bureau indicates that housing starts and building permits dropped in May to their lowest levels since 2020.
Additionally, existing home sales have fallen for three consecutive months, while median sales prices have reached new highs.
The total number of homes under construction has also decreased by 5.1% this year, marking the largest five-month decline since 2010.
Chart That Caught Our Eye
Analyst Team Note:
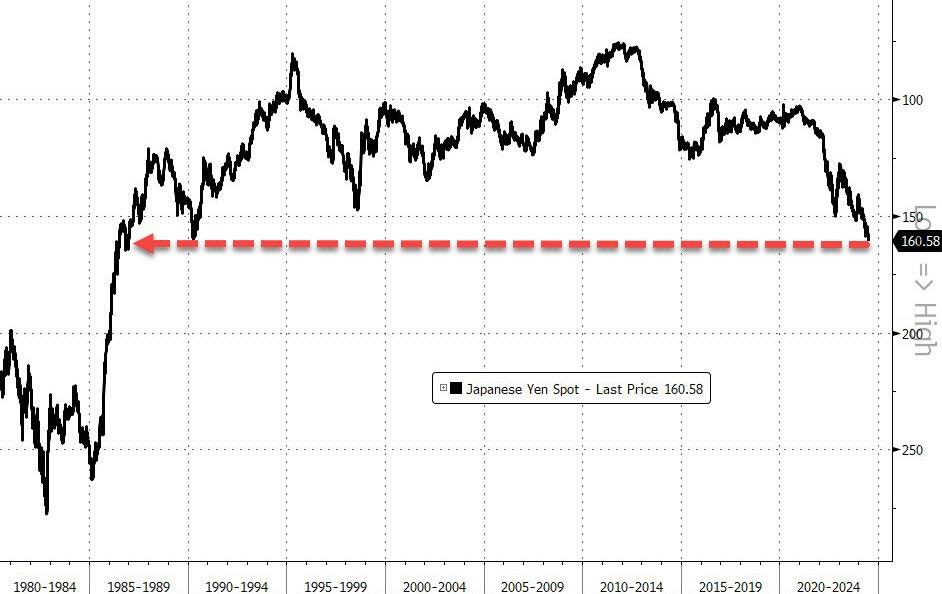
Japanese officials are expressing heightened concern over the rapid and one-sided weakening of the yen, with Vice Finance Minister Masato Kanda emphasizing the government's urgent monitoring of the situation and readiness to take necessary actions against excessive movements.
Despite these warnings, the yen has continued to decline, reaching its weakest level since 1986 against the dollar.
Japan has already spent $61.3 billion on interventions between April and May, selling Treasuries to fund these actions.
The U.S. Treasury Department has added Japan to its "monitoring list" for foreign-exchange practices, reflecting international scrutiny of Japan's efforts to stabilize its currency.
Sentiment Check
Make sure to check Larry’s most recent market updates via his personal newsletter.