6.12.23: Markets Continue To Accelerate Its Strength Ahead of June FOMC
For Public Readers: Weekly Key U.S. and China brief market notes by Larry Cheung's Analyst Staff Team for our Public Email List

Note to Readers from Larry: The only way to really understand this market is by doubling-down efforts on fundamental analysis to understand the valuation inputs the Street is assigning to the leaders of this rally.
Key Investing Resource: Strategist Larry uses Interactive Brokers as his core brokerage. Feel free to check out IB. I currently park excess cash (yielding 4.5%+ on idle cash) at Interactive Brokers
In our emails, we will provide the following coverage points:
Brief Overview of U.S. & China Markets
Macro Chart in Focus
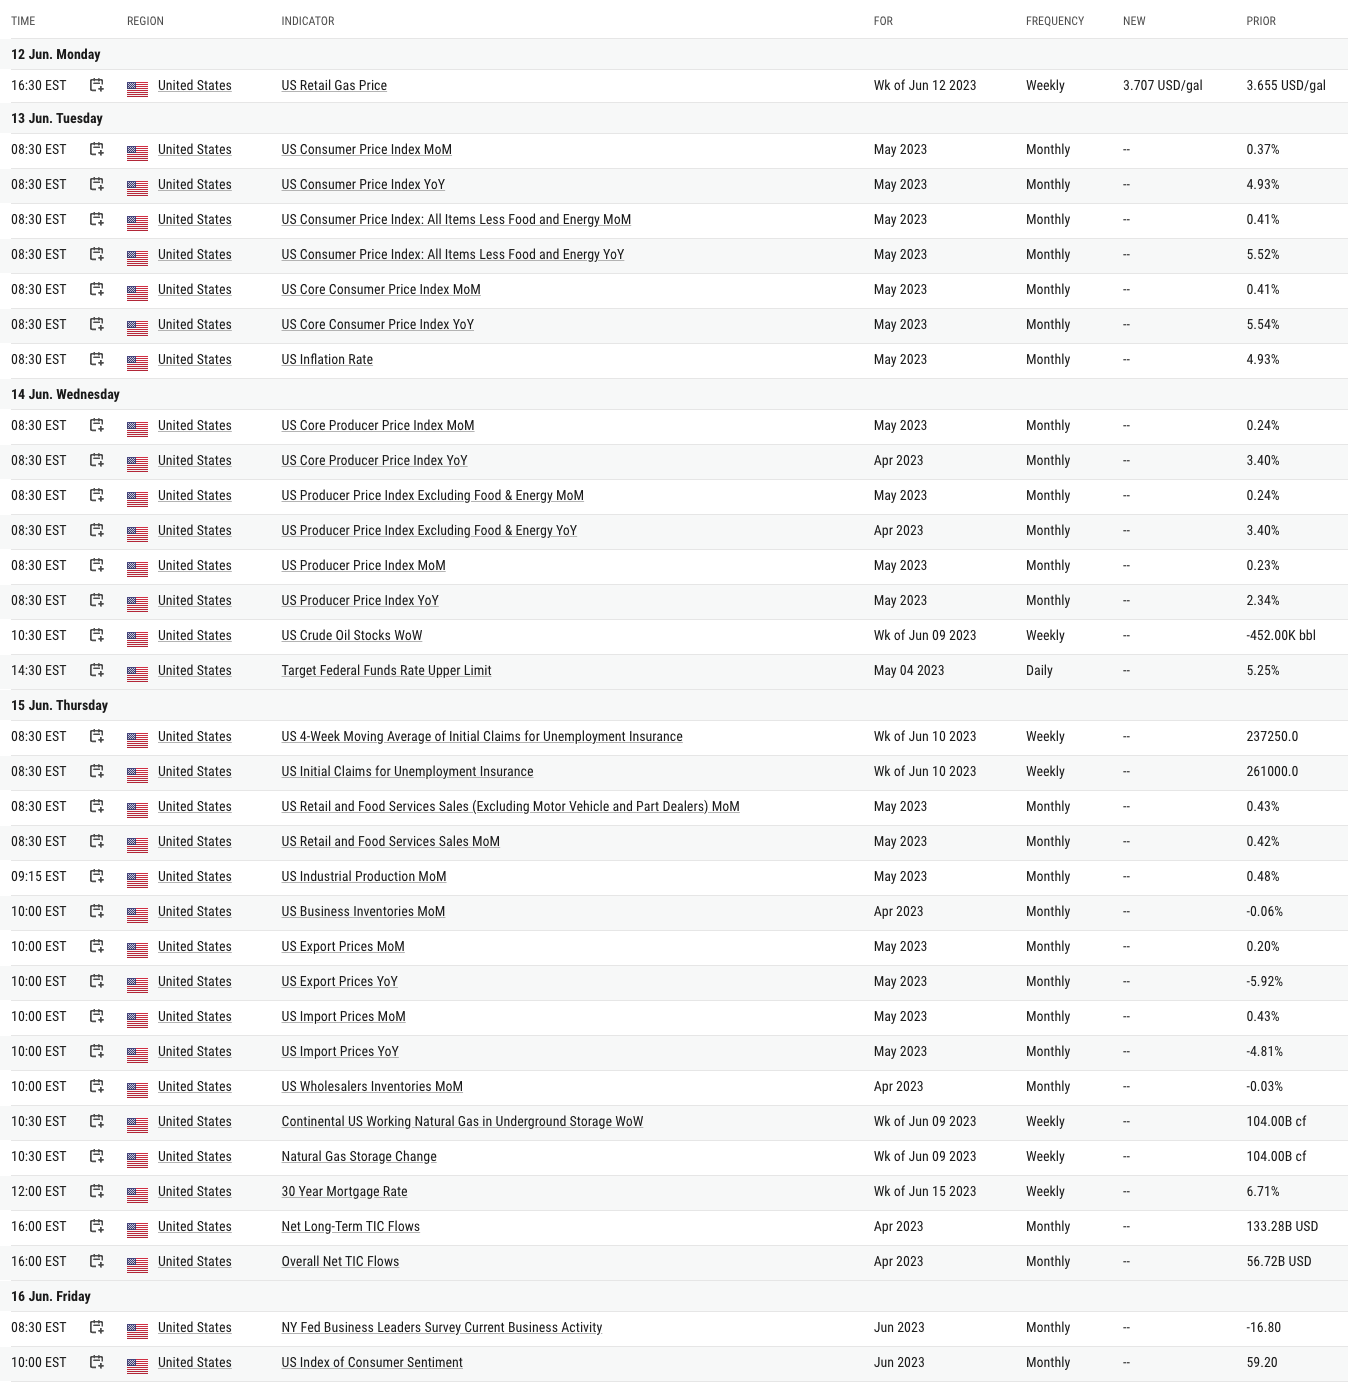
U.S. & China Upcoming Economic Calendar
Chart That Caught Our Eye
U.S and China Markets Brief Snapshot 🇺🇸 🇨🇳
(Powered by our Channel Financial Data Provider YCharts)
S&P 500 Index: 4298.86
KWEB (Chinese Internet) ETF: $27.90
Analyst Team Note:
The SPX entered its 27th bull market of 20% or more on June 8th. Going back to 1929, these cyclical bull markets have lasted 33.6 months on average (17.4 median) with an average return of 114.4% (76.7% median).
The year after the SPX enters a cyclical bull market shows the SPX higher 65% of the time on an average return of 9.4% and a median return of 14.1%, which equates to SPX 4700 and SPX 4900, respectively, into June 2024.
Going back to 1950, cyclical bull markets on the SPX of 20% or more have lasted 53.9 months on average (47.3 median) with an average return 155.25% (93.92% median).
The year after the SPX entered these cyclical bull markets shows the SPX higher 92% of the time on an average return of 19.0% and a median return of 17.8%, which equates to SPX 5100 and SPX 5060, respectively into June 2024.
Macro Chart In Focus
Analyst Team Note:
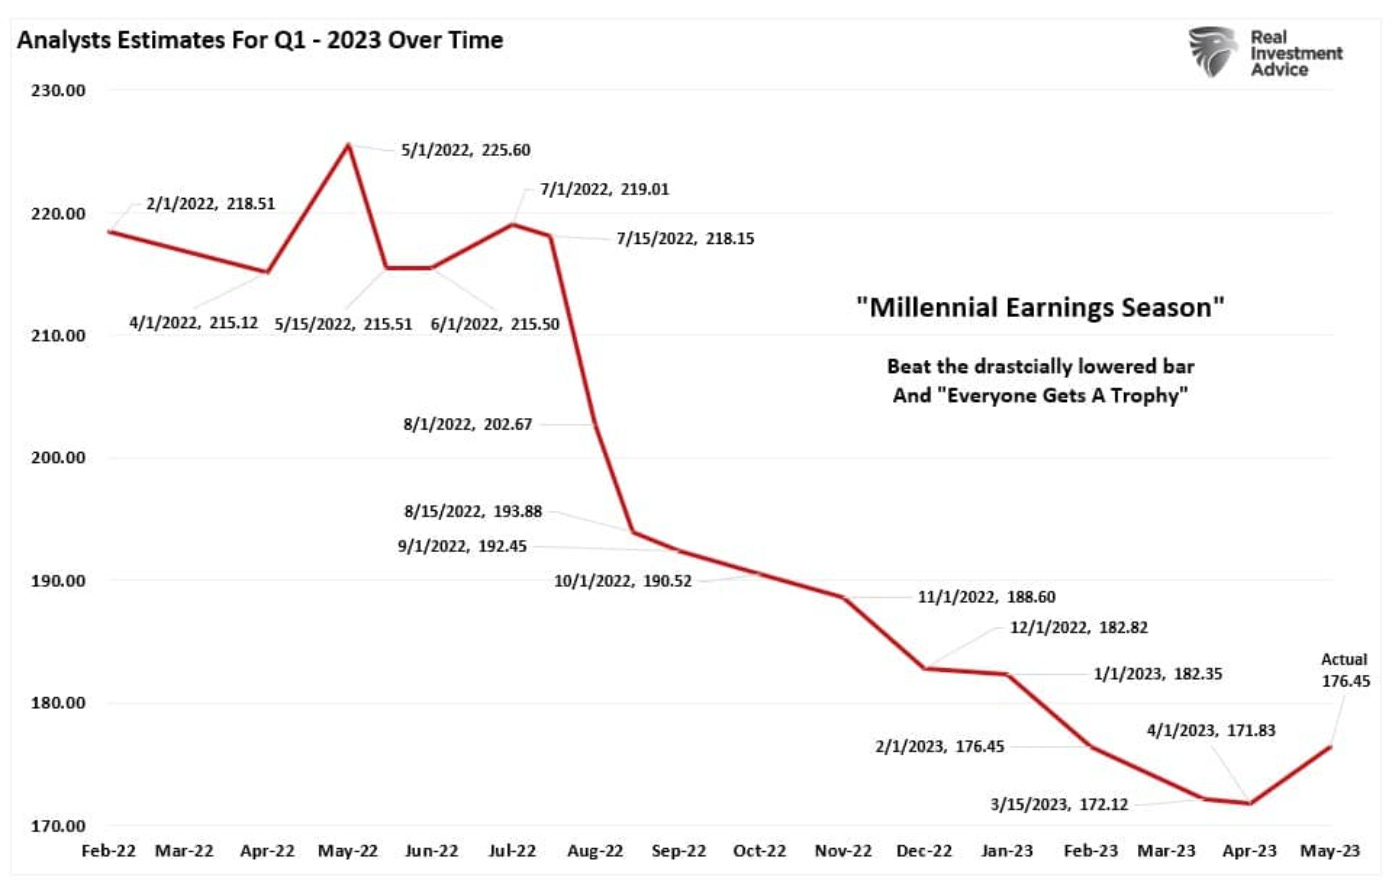
The latest reports indicate that 78% of S&P 500 companies have posted earnings per share (EPS) above the mean EPS estimate, marking an increase from the 10-year average of 73%. This is the highest percentage of companies reporting a positive EPS surprise since Q3 2021, which was at 82%. In total, earnings have surpassed estimates by 6.5%, also exceeding the 10-year average of 6.4% and marking the highest surprise percentage since Q4 2021.
However, it's important to consider the context behind these figures. Wall Street routinely lowers estimates as the reporting period draws near, essentially ensuring a high beat rate. This has led to approximately 70% of companies regularly surpassing estimates by 5%, regardless of the economic and financial conditions. These numbers would probably be lower if analysts were held to their original estimates made when the reporting period begins.
Upcoming Economic Calendar
(Powered by our Channel Financial Data Provider YCharts)
U.S Economic Calendar (Upcoming Data Points)
China Economic Calendar (Upcoming Data Points)
Analyst Team Note:
The shortening average time to maturity of US junk bonds indicates that a significant volume of corporate debt is set for refinancing within the next few years. This trend is largely due to a slowdown in the issuance of high-yield primary market securities, and increased demand from investors for short-term obligations, reflecting growing concerns about potential corporate defaults and a looming recession.
This shift presents a challenging situation, especially if financial markets experience a liquidity crunch, making it difficult for corporations to meet their debt maturities.
If companies struggle to refinance their short-term debts due to liquidity issues, this could increase corporate defaults, negatively impacting the financial sector, especially lenders and investors in high-yield bonds. Additionally, this could disrupt the broader economy, causing job losses. On the flip side, if markets remain liquid, companies might be able to manage their maturing debts through issuance or refinancing, thus averting a potential crisis.
Chart That Caught Our Eye
Analyst Team Note:
Market makers and customers are the dominant players in SPX 0 Day-To-Expiration options, while broker-dealers, professional customers, and firms have little activity in the space.
Found it interesting that customers tend to open 2x as many long contracts as shorts across the full trading day and have a high close-out rate, typically exiting up to 65-70% of contracts before the close.
Sentiment Check
Make sure to check Larry’s most recent market updates via his personal newsletter.


