Make sure to check out Interactive Brokers above as idle cash now will yield more than 4.5% as the Fed just raised rates.
Key Investing Resource: Strategist Larry uses Interactive Brokers as his core brokerage. Feel free to check out IB. I currently park excess cash at Interactive Brokers. Check it out. It’s a great brokerage.
In our emails, we will provide the following coverage points:
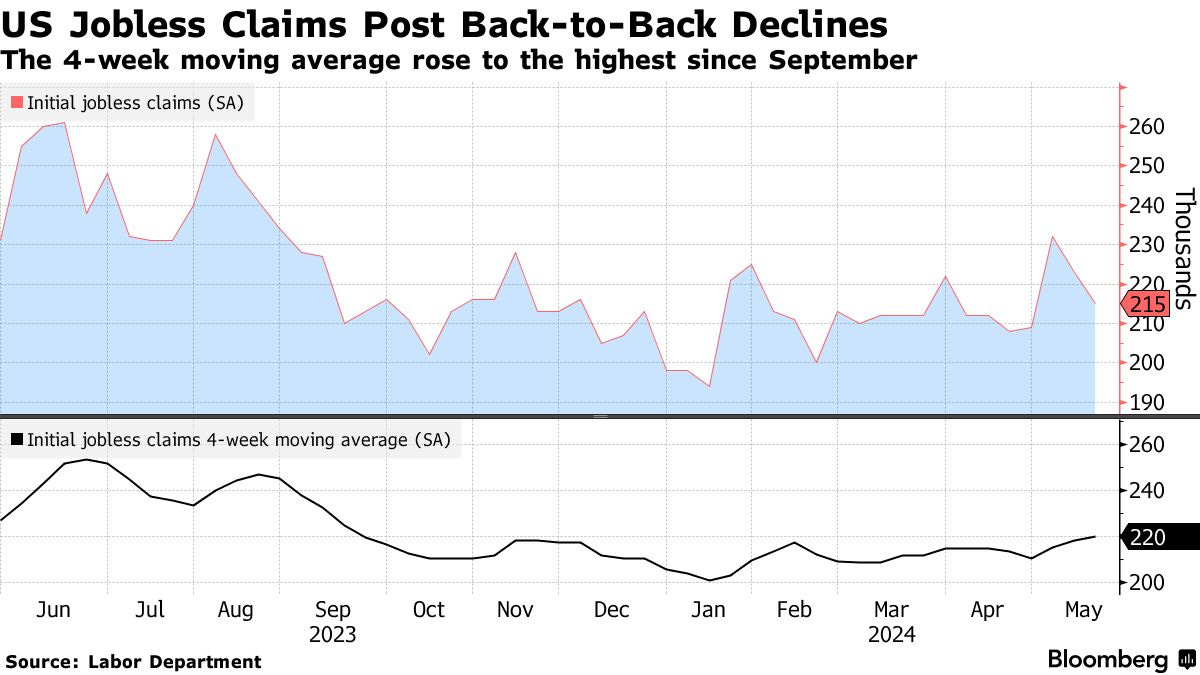
Initial applications for US unemployment benefits decreased by 8,000 to 215,000, marking the largest consecutive decline since September.
Continuing claims, the number of people receiving unemployment benefits, were at 1.79 million.
Despite this drop, the labor market shows signs of cooling, with a slowdown in hiring and fewer mentions of layoffs and labor shortages in companies' earnings calls.
In the 20 years that preceded the Covid-19 pandemic, weekly initial applications averaged about 345,000, and continuing claims roughly 2.9 million.
US business activity surged in early May at its fastest pace in two years, driven by strong growth in service providers and a rise in inflation.
This reflects an acceleration in overall activity halfway through the second quarter, despite subdued April retail sales and a decline in factory output.
Input prices rose to the second-highest level since September, with manufacturing now contributing more to inflation than services.
Factory input prices increased at the fastest rate since November 2022, and both costs and selling prices in services also saw gains.
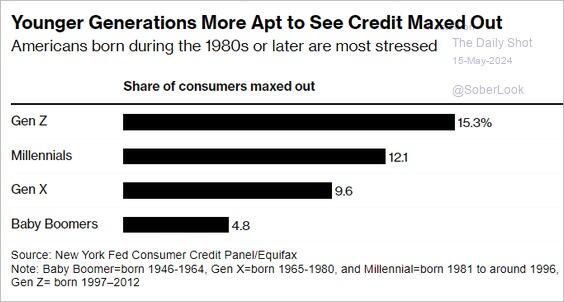
Chart That Caught Our Eye
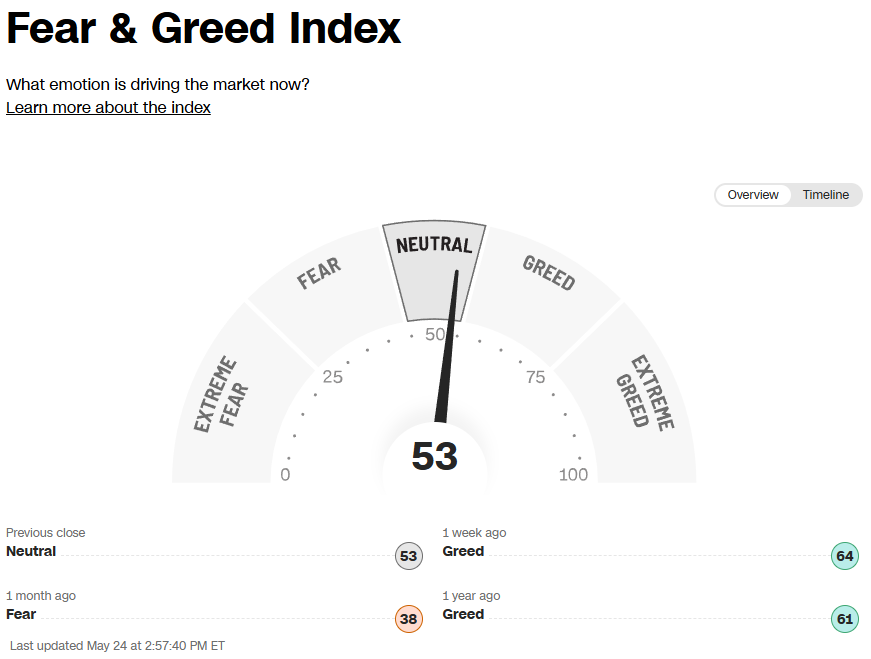
Sentiment Check
Make sure to check Larry’s most recent market updates via his personal newsletter.