Note to Readers from Larry: I’m excited to bring back our upgraded Investment Dashboard with my primary focus list of names to include helpful valuation ranges data, key resistance/support levels, and price momentum information to best help our members understand risk/reward on the market’s most important names on a weekly basis.
I have a primary focus list which the Dashboard includes my opinions on. I also have a secondary watchlist where if opportunities arise, I make direct call outs in my newsletters (like Marriott, Texas Instruments, and etc). I don’t include secondary watchlist names in the Dashboard because that would make the size of the dashboard overwhelming.
Key Investing Resource: Strategist Larry uses Interactive Brokers as his core brokerage. Feel free to check out IB. I currently park excess cash (yielding 4.5%+ on idle cash) at Interactive Brokers
In our emails, we will provide the following coverage points:
Apple is undoubtedly an economic force. With a market capitalization nearing $3 trillion, their strong performance has continuously defied expectations, with both earnings and revenue surpassing projected numbers. This success can be attributed largely to a robust rebound in iPhone sales and significant growth in its Services business, which includes areas like the App Store, iCloud, and Apple Music.
However, Apple's considerable influence in major stock indices poses a unique challenge to the market. With its shares accounting for nearly 7.5% of the S&P 500 Index, any significant reversal in its current rally could impact the broader market.
Macro Chart In Focus
Analyst Team Note:
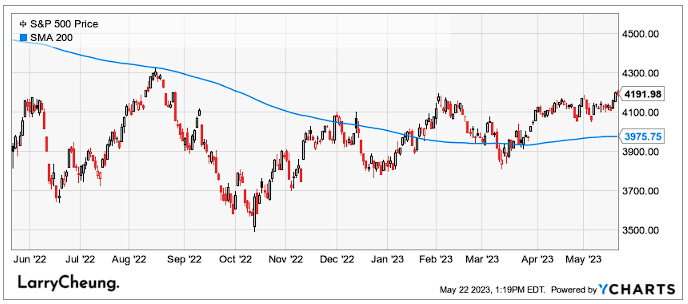
Despite discussions on the debt ceiling, dedollarization, the impact on earnings, inflation's trajectory, and interest rates, the S&P 500 has remained stuck in a trading range of 3,800 to 4,200 for several months.
Even favorable conditions like expected inflation rates and a better-than-feared earnings season couldn't nudge the S&P 500 out of its stagnant position.
Remarkably, the index is trading around the same level as it was one and even two years ago. The blended year-on-year earnings decline for Q1 is -2.4%, marking the second consecutive quarterly decline for earnings. Although this is an improvement from the predicted -6.7% decline at the beginning of the earnings season, revenue growth is slower at 4.0% for Q1, a significant deceleration from last year's double-digit growth.
However, cost-cutting measures and falling input prices have resulted in better-than-expected profit margins of 11.5% compared to 11.3% in Q4 2022, following six quarters of sequential declines. Despite descending from a net profit margin peak of 13% in Q2 2021, most sectors surprisingly reported higher margins.
While market results prompted little price reaction for the average stock, a few stocks are driving the S&P 500 higher, with five stocks alone contributing to over 80% of the year-to-date gain. Despite this outperformance from the top names, the S&P 500 is only up 7.8% for the year, with the average stock up just 1.6%.
On valuation, the top five names in the S&P 500 trade at a 25.1x forward earnings per share, whereas the rest of the index (excluding the top five) trades at 16.4x.
While consumer finance metrics remain strong, there are signs of macroeconomic weakness. Employment indicators have shown year-on-year deterioration, yet the unemployment rate in April was still relatively low at 3.4%, down 10 basis points from March. Despite slowing wage growth, the Fed continues to consider strong unemployment levels and price indices for potential rate hikes. Signs of price cooling have emerged.
Consumers continue to spend, leading to a year-on-year increase in adjusted retail and food sales and credit card balances, despite higher inflation. However, the mortgage environment is becoming more challenging due to higher interest rates, resulting in lower loan originations and worsening affordability.
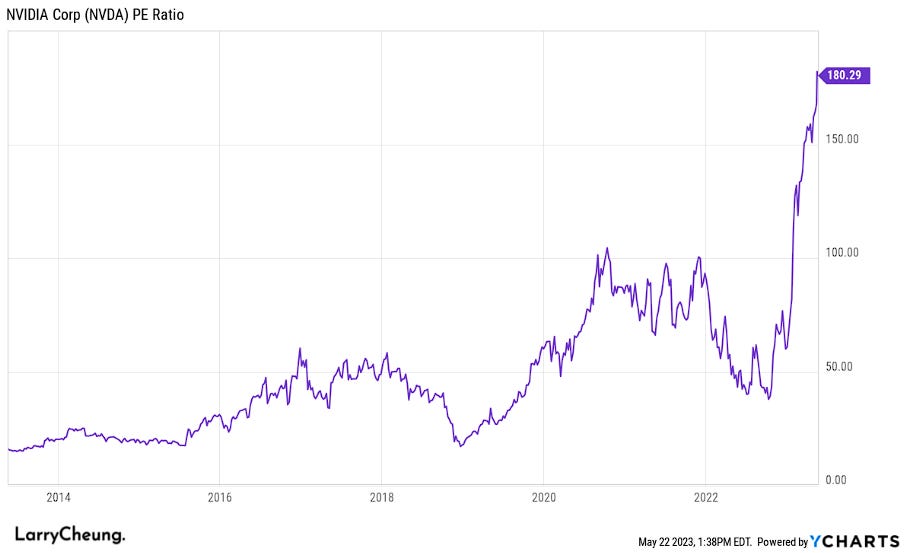
Chart That Caught Our Eye
Analyst Team Note:
Bubble in the making…
Sentiment Check
Make sure to check Larry’s most recent market updates via his personal newsletter.