5.19.23: Stocks soar to levels not seen since the beginning stages of 2022 Selloff.
For Public Readers: Weekly Key U.S. and China brief market notes by Larry Cheung's Analyst Staff Team for our Public Email List

Note to Readers from Larry: Folks, generally speaking, this has been a decent week for longer term investors who have patiently waited for markets to recover. With the index level performing strongly, volatility has been relatively subdued. For traders, this environment has been more tricky as political developments have the ability to return the markets to choppy patterns.
My next Investment Strategy note for members will be released this weekend. Stay tuned.
Key Investing Resource: Strategist Larry uses Interactive Brokers as his core brokerage. Feel free to check out IB. I currently park excess cash (yielding 4.5%+ on idle cash) at Interactive Brokers
In our emails, we will provide the following coverage points:
Brief Overview of U.S. & China Markets
Macro Chart in Focus
U.S. & China Upcoming Economic Calendar
Chart That Caught Our Eye
U.S and China Markets Brief Snapshot 🇺🇸 🇨🇳
(Powered by our Channel Financial Data Provider YCharts)
S&P 500 Index: 4198.05
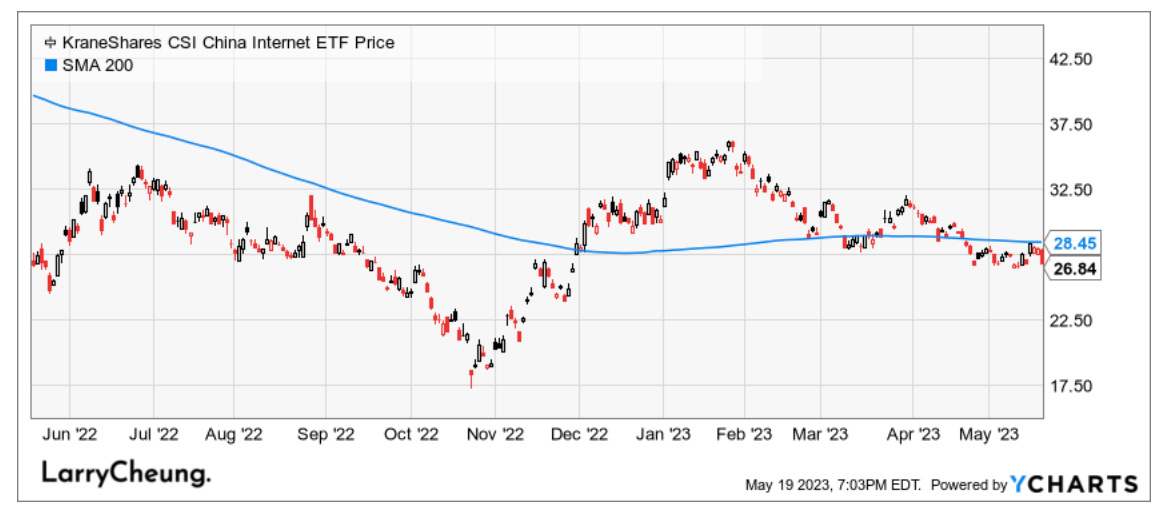
KWEB (Chinese Internet) ETF: $26.84
Analyst Team Note:
Despite a 17% rally in the S&P 500 since October, the market sentiment among money managers has reportedly dropped to its lowest level for the year, based on a Bank of America survey. The general bearishness has seen funds being shifted into the safer technology sector and away from economically sensitive stocks such as banks. Hedge funds have also shown caution, with cyclical holdings falling to October 2020 levels relative to defensive shares.
However, the stock market has been responsive to any semblance of good news, which sparked a rally and led the S&P 500 to its highest level in nine months. The key question for investors is whether the damage done to sentiment by the Fed's rate hikes last year is enough to account for future economic events. There is an argument that skepticism is already reflected in share prices, which may offer some protection should analyst forecasts for next year prove overly optimistic. This argument suggests a market-implied profit target significantly lower than what is currently expected.
Macro Chart In Focus
Analyst Team Note:
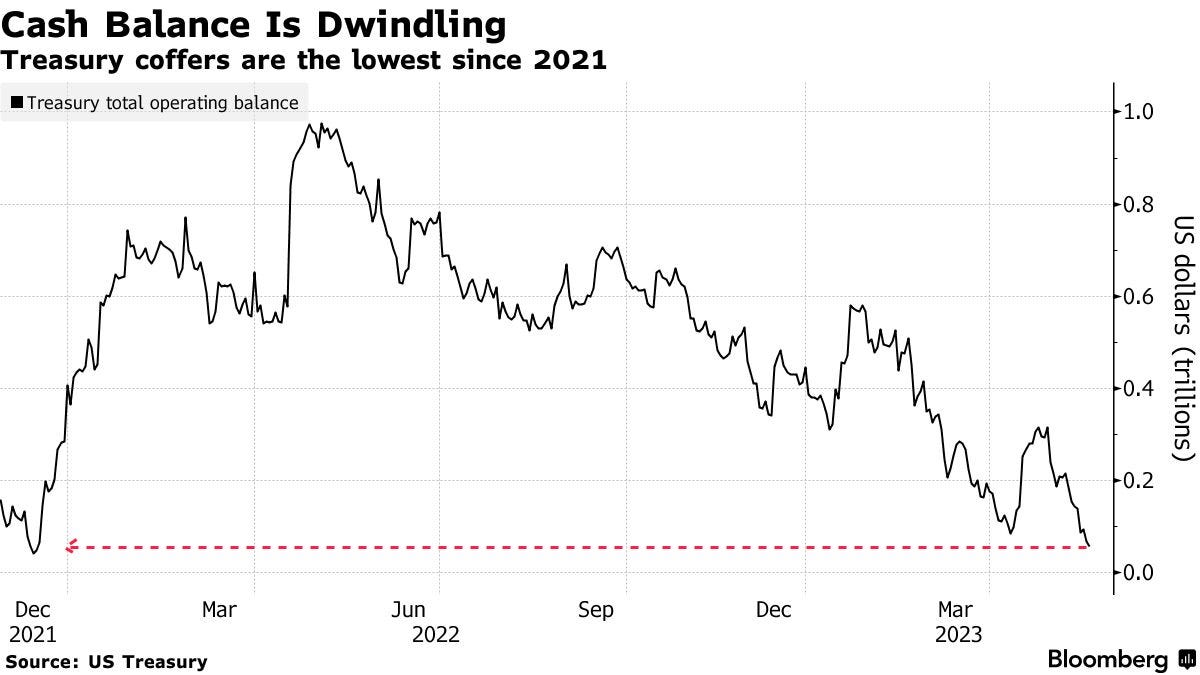
The U.S. Treasury's options to prevent the federal government from reaching its borrowing limit are dwindling as its cash reserves shrink to the lowest levels since 2021, despite a slight increase in extraordinary measures funds. As of May 17, the Treasury stated that it had $92 billion in extraordinary measures available to continue paying government bills. This figure, up slightly from $88 billion on May 10, represents just over a quarter of the authorized $333 billion in extraordinary measures to stave off reaching the statutory debt ceiling.
Simultaneously, the Treasury's cash balance has decreased, falling to $57.3 billion as of May 18, dropping from $68.3 billion the previous day to $140 billion at the end of last week. The Treasury's bank account has been strained due to efforts to avoid exceeding the $31.4 trillion debt limit.
Upcoming Economic Calendar
(Powered by our Channel Financial Data Provider YCharts)
U.S Economic Calendar (Upcoming Data Points)
China Economic Calendar (Upcoming Data Points)
Analyst Team Note:
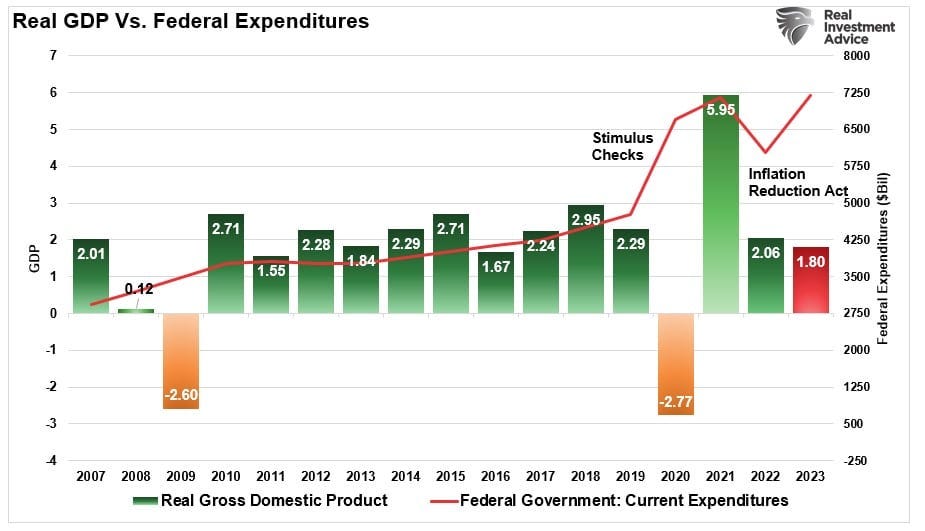
In the first quarter of 2023, Federal spending increased by 3% on a quarter-over-quarter basis. Using that increase as a baseline, we can project federal spending through the end of the year, which will eclipse $7 Trillion at the current run rate. Of course, if the current Republican-controlled house can negotiate some spending cuts while raising the debt ceiling, that number will decline.
The point here is that while many economists and analysts are predicting a sharp slowdown and recession later this year, which is indeed possible, there is still a lot of liquidity supporting economic activity in the near term.
Chart That Caught Our Eye
Analyst Team Note:
“The Biggest Picture: AI, for now, a “baby bubble”; bubbles in right things (e.g. internet) & wrong things (e.g. housing) always started by easy money, always ended by rate hikes; new AI mania + 5% inflation, 3% unemployment, 7% budget deficits in ‘23…biggest “pain trade” next 12 months is Fed funds rate at 6%, not 3%.” - Michael Hartnett
Sentiment Check
Make sure to check Larry’s most recent market updates via his personal newsletter.


