Note to Readers from Larry: The market continues to impress to the upside for Bulls, and many resistance levels have been broken. While bearish catalysts may return at any given moment, the pain trade is further upside before any correction (as discussed in a previous private note).
In the meantime, I released a thoughtful video on life perspectives to help folks get ahead in their financial freedom journey. Hope you enjoy. 😊
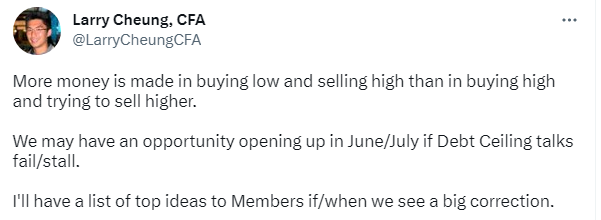
Follow me on Twitter and Instagram for more commentary.
Key Investing Resource: Strategist Larry uses Interactive Brokers as his core brokerage. Feel free to check out IB. I currently park excess cash (yielding 4.5%+ on idle cash) at Interactive Brokers
In our emails, we will provide the following coverage points:
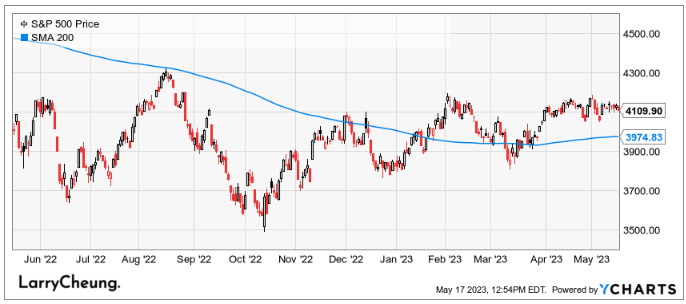
After the recent rally, the S&P 500 P/E is closer to 19x than 18x, is now statistically expensive on every metric and is trading at a historical premium to every asset class except 10yr Tsy bonds (whose valuation it has been rapidly approaching).
The S&P 500 premium converging with the bond premium is not a coincidence: the S&P 500 resembles a long duration, low coupon bond – its composition is dominated by mega cap, long term growth stocks that typically don’t pay dividends but flourished during QE. Both asset classes will likely do well if real rates fall from here.
Macro Chart In Focus
Analyst Team Note:
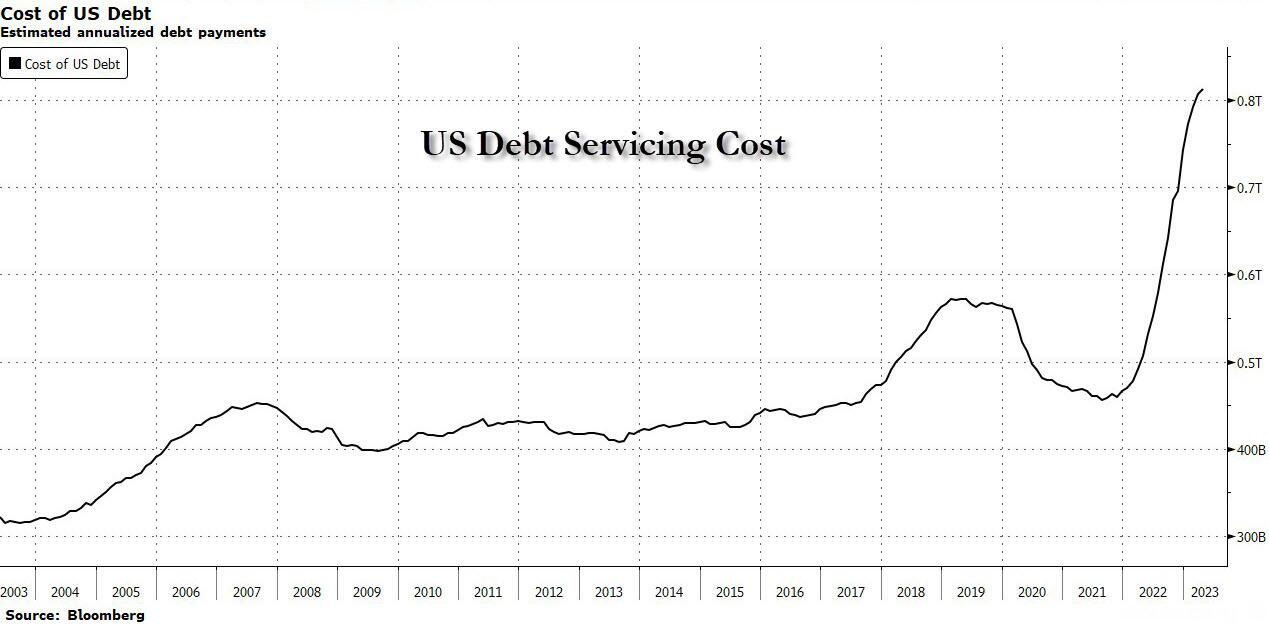
Thanks to rising yields, the US government now has to spend more each year on servicing its immense debt burden than it spent on national defense in 2022.
Estimated annualized debt-servicing costs are about 90% higher than they were back in 2011. This is partially due to an exploding debt pile, but also due to a significant shift higher in US yields. In 2022, based on how the Treasury breaks down line items, the US government only spent more on social security ($1,244b) and health ($909b), with income security in line with today’s debt-servicing costs at $813b.
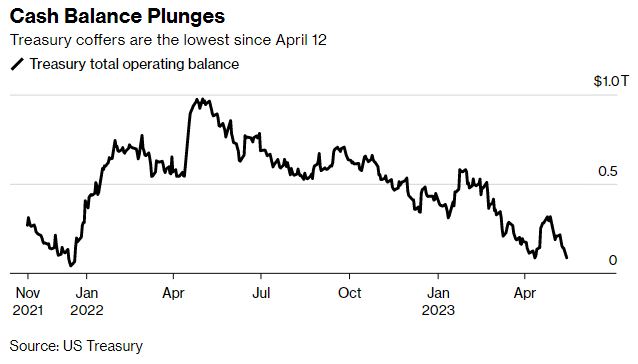
The US government’s ability to pay its debts and meet its spending obligations ultimately comes down to whether it has enough cash, so the amount sitting in its checking account is crucial. That figure fluctuates daily depending on spending, tax receipts, debt repayments and the proceeds of new borrowing, and if it gets too close to zero for the Treasury’s comfort that could be a problem. The larger-than-anticipated drop in the Treasury’s cash balance suggests the prospects for avoiding a June X-date have worsened.
Chart That Caught Our Eye
Analyst Team Note:
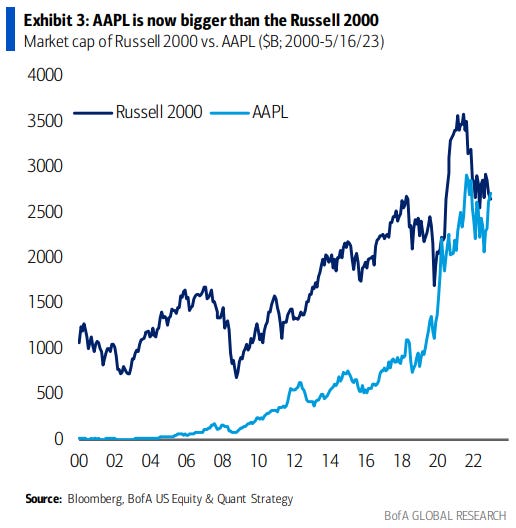
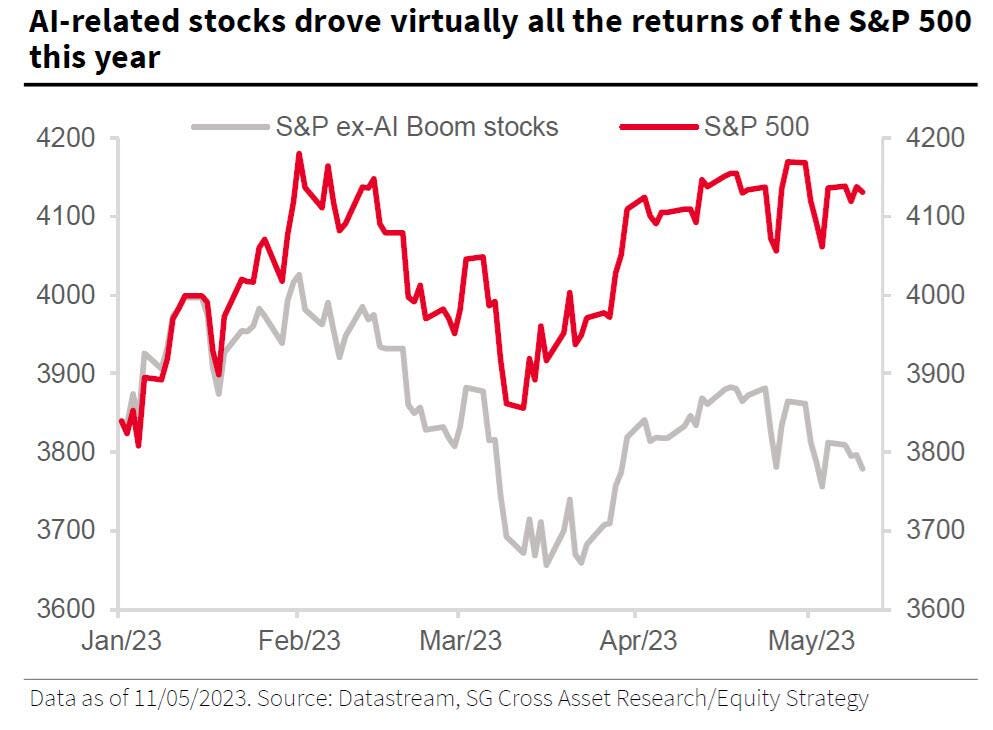
According to SocGen calculations, if you exclude the impact of the market's AI hypetrain, the S&P would be down 2% instead of up 8%.
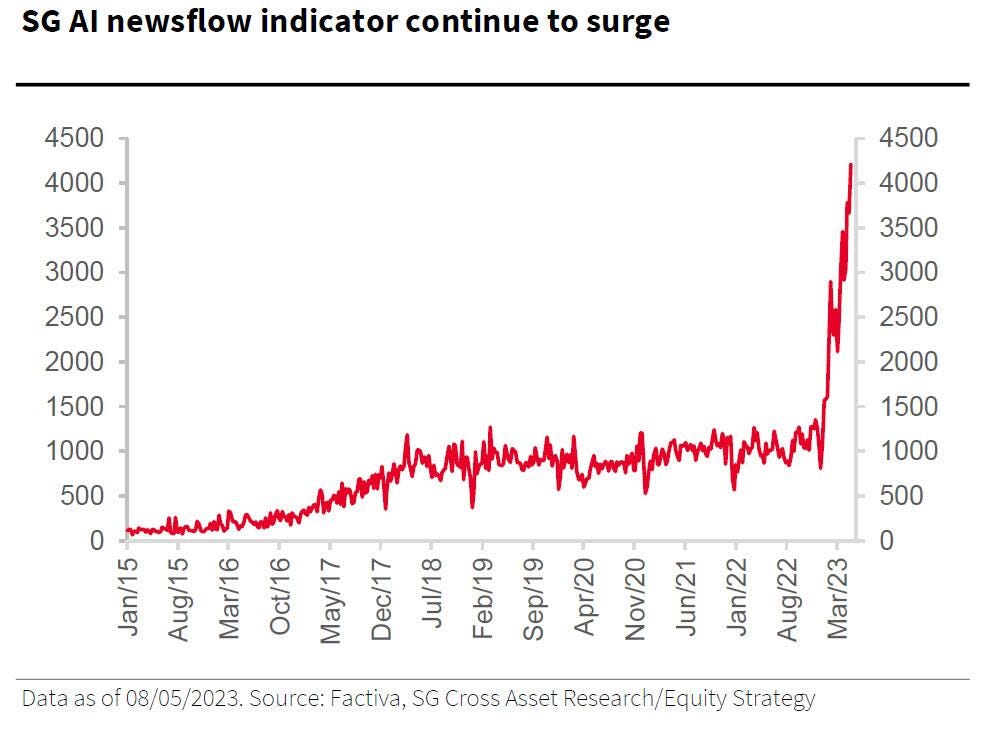
Meanwhile, the AI sentiment news indicator keeps rising exponentially…
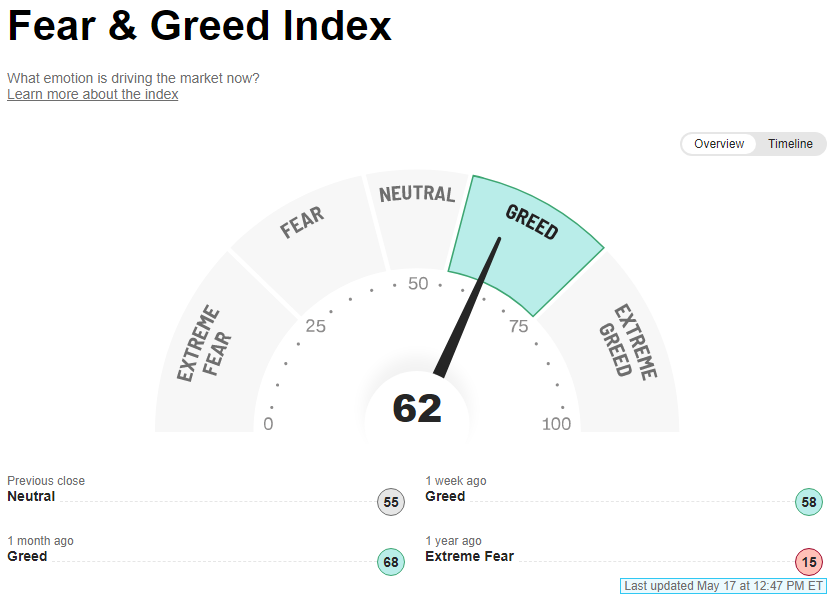
Sentiment Check
Make sure to check Larry’s most recent market updates via his personal newsletter.