Note to Readers from Larry: Happy Friday Folks and have a good Mother’s Day this Sunday in advance. My next Strat note will likely be published by mid-week next week as I do need to spend time with Mum this weekend.
Until then, all of the themes that I’ve discussed up until this point continue to be in play: 1.) China is a Trade, 2.) Banking was a trade, 3.) The Market is likely to see range expansion soon.
We saw a 10% upward move in BABA/JD earlier this week from range lows, and the market then sold them back off on Friday.
What does this tell us? Once again, as a Trader, you most likely benefited if you were looking for a 3-8% move. As an Investor, the China Internet Sector once again makes durable gains elusive.
This distinguishment was highlighted in my last note, and my view has not changed. On China stocks, I think this market is rewarding Traders but not so much Investors.
My Investment Community now specifically curates ideas based on this market context. While I believe this market will provide us trading opportunities, at this valuation juncture, I do not believe this market is safe for longer-term investment.
In fact, it is my sincere belief it’s becoming more and more treacherous by the day. More commentary to navigate this pivotal moment inside our Investment Community.
Key Investing Resource: Strategist Larry uses Interactive Brokers as his core brokerage. Feel free to check out IB. I currently park excess cash (yielding 4.5%+ on idle cash) at Interactive Brokers
In our emails, we will provide the following coverage points:
Cash: pace of inflows slowing, 4-week average smallest in 10 weeks
Treasuries: largest inflow in 6 weeks ($6.3bn)
HY bonds: largest outflow in 6 weeks ($1.8bn)
Tech: largest inflow since Dec’21 ($3.0bn)
Financials: largest outflow since May’22 ($2.1bn).
Macro Chart In Focus
Analyst Team Note:
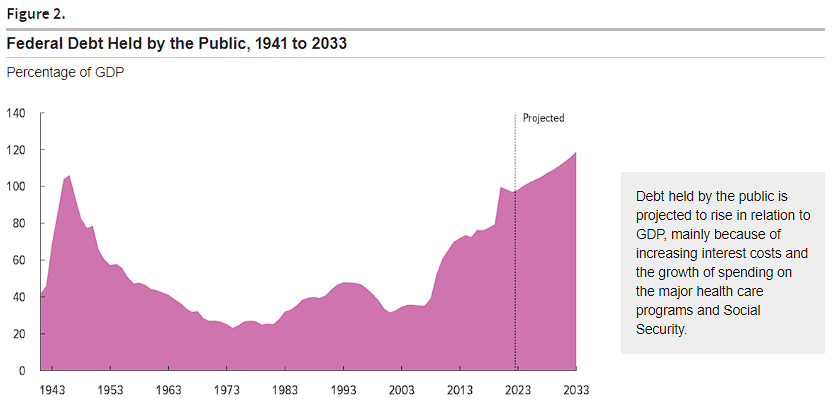
The Congressional Budget Office (CBO) has raised its estimate for the US budget deficit by $130 billion for 2023, bringing the total projected shortfall to $1.54 trillion. This revision presents a worse fiscal outlook than previously forecasted in February, which is likely to be utilized by Republican negotiators in the current debt-limit showdown with Democrats. The CBO also reiterated a "significant risk" of a US payments default in early June unless the federal debt ceiling is raised.
President Joe Biden and House Speaker Kevin McCarthy are embroiled in a political struggle over increasing the $31.4 trillion debt limit. Democrats are pushing for a "clean" increase or suspension, akin to what was done during previous administrations.
The $130 billion deficit increase matches the amount of discretionary spending cuts that McCarthy is proposing in the debt-limit talks. The 9% deficit estimate increase for the fiscal year includes higher spending for student loan repayment programs, deposit insurance accounts, and rising interest costs. Some of these increases were offset by reduced Medicare Advantage spending due to changes in reimbursement rules.
Looking ahead, the CBO projects that over the next decade, deficits will total $20 trillion and federal debt held by the public will reach $46.7 trillion by 2033. This equates to 119% of gross domestic product, the highest in recorded US history. By 2033, annual deficits are expected to reach $2.7 trillion, or 6.9% of GDP, compared with a 50-year average of 3.6%.
“The Biggest Picture: need to go back to early ‘50s to see low 3.4% unemployment rate coexist with low 37% Presidential approval rating (Charts 2 & 3); inflation sole macro reason for disapproval…maybe not a good idea for Fed to pause when inflation 5%, maybe June risk isn’t debt ceiling but another month of “rate hike” jobs & inflation data.” - BofA’s Michael Hartnett
Chart That Caught Our Eye
Analyst Team Note:
Should I put cash to work or wait until … the debt ceiling x-date / the recession that hovers two quarters in the distance / the Fed cuts rates / inflation subsides / Russia/Ukraine cease-fire / [fill in blank]?
The good news is everyone is talking about the bad news. News trends are at levels only seen during actual recessions.
Lengthen your time horizons when it comes to the index. 10-yr S&P 500 returns have rarely been negative, but the one-day loss ratio is just slightly better than a coin flip.
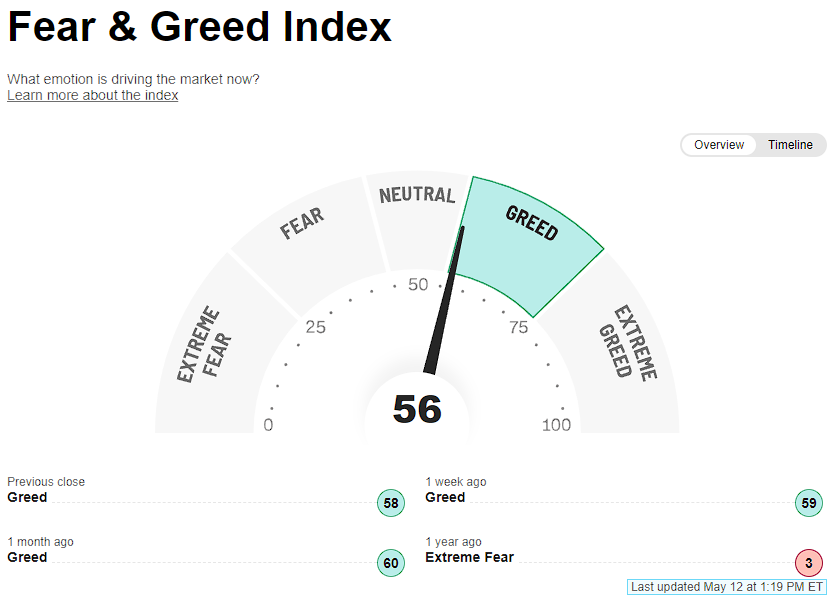
Sentiment Check
Make sure to check Larry’s most recent market updates via his personal newsletter.