Note to Readers from Larry: We have finally seen a modest pullback in QQQ related names after a relentless rally. Based on today’s pullback, while some names did exhibit large decline percentages on the surface, key names actually were bought up intraday in smaller timeframes upon closer inspection. In fact, NVDA closed at higher levels than its opening gap down price. I believe several critical names are grossly overbought, but the resilience in intraday action is notable and even respectable.
This leads me to believe that Bears may not have fully controlled the market yet, and it will take more sessions of softening before it’s clear the recent run is over. Perhaps that day is the Friday Jobs report, but it certainly was not today - in my view.
If you are in TLT, it would be in your best interest to understand the inner dynamics that drive the U.S. treasury market and what could inhibit its positive outlook (despite a clear recession on the horizon). TLT ETF Investors should do their homework and understand what level may serve as critical, critical resistance and the potential top of any major Treasury resurgence.
Strategist Larry uses Interactive Brokers as his core brokerage. Feel free to check out IB. I currently park excess cash (yielding 4%+ on idle cash) at Interactive Brokers.
In our emails, we will provide the following coverage points:
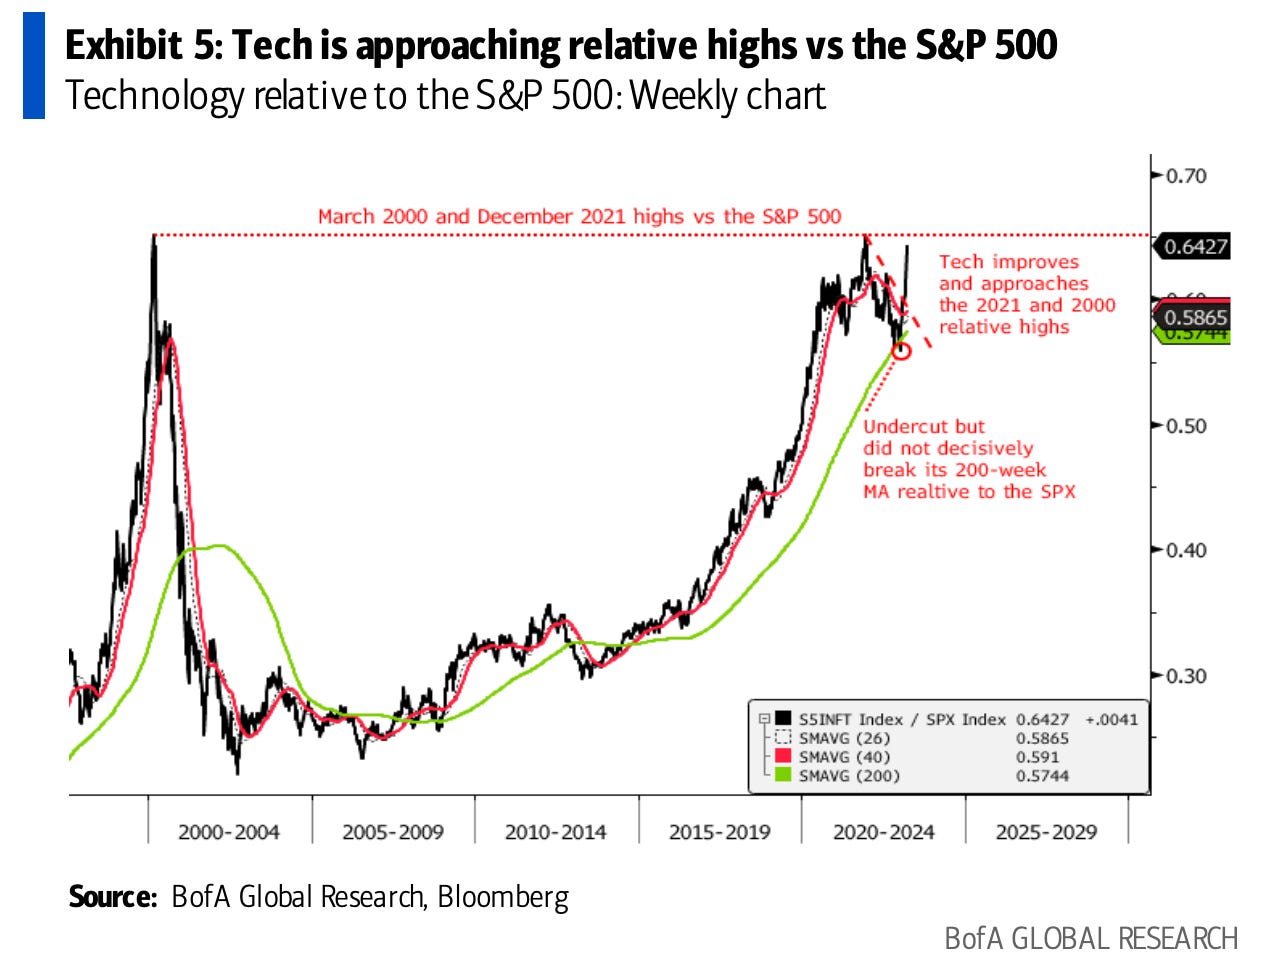
The biggest 20 stocks in the S&P 500 have added roughly $2 trillion in the market cap so far this year; the other 480 have added $170 billion. As tech approaches relative highs vs. the S&P 500, expect significant resistance.
Macro Chart In Focus
Analyst Team Note:
A large portion of the outflows of small bank deposits was reallocated to larger banks, given perceptions of greater safety—some large banks are subject to higher capital buffers—while other portions were most likely reallocated to money market funds. Money fund assets tend to increase rapidly in periods of stress.
New York Fed research has found that historically a 1 percentage point increase in the effective federal funds rate, which is closely related to MMF yields, increases money fund AUM by 6 percentage points over 2 years.
Americans are working less than they did before the pandemic, which may benefit many but is potentially problematic for the Federal Reserve in its efforts to combat inflation.
New studies reveal that the average workweek in the US has decreased by over 30 minutes in the past three years. This reduction in work hours has resulted in a labor shortage equivalent to 2.4 million workers. This shortage contributes to the strain on a heated job market that Jerome Powell and the Fed are attempting to stabilize in order to reduce the inflation rate that currently exceeds their 2% target by more than double.
Chart That Caught Our Eye
Analyst Team Note:
VC-backed unicorns are privately-held startup companies that have a valuation of over $1 billion and are supported by venture capital (VC) funding. Since the Fed began tightening in March 2022, the number of unicorns created has completely collapsed. The effects of ZIRP…
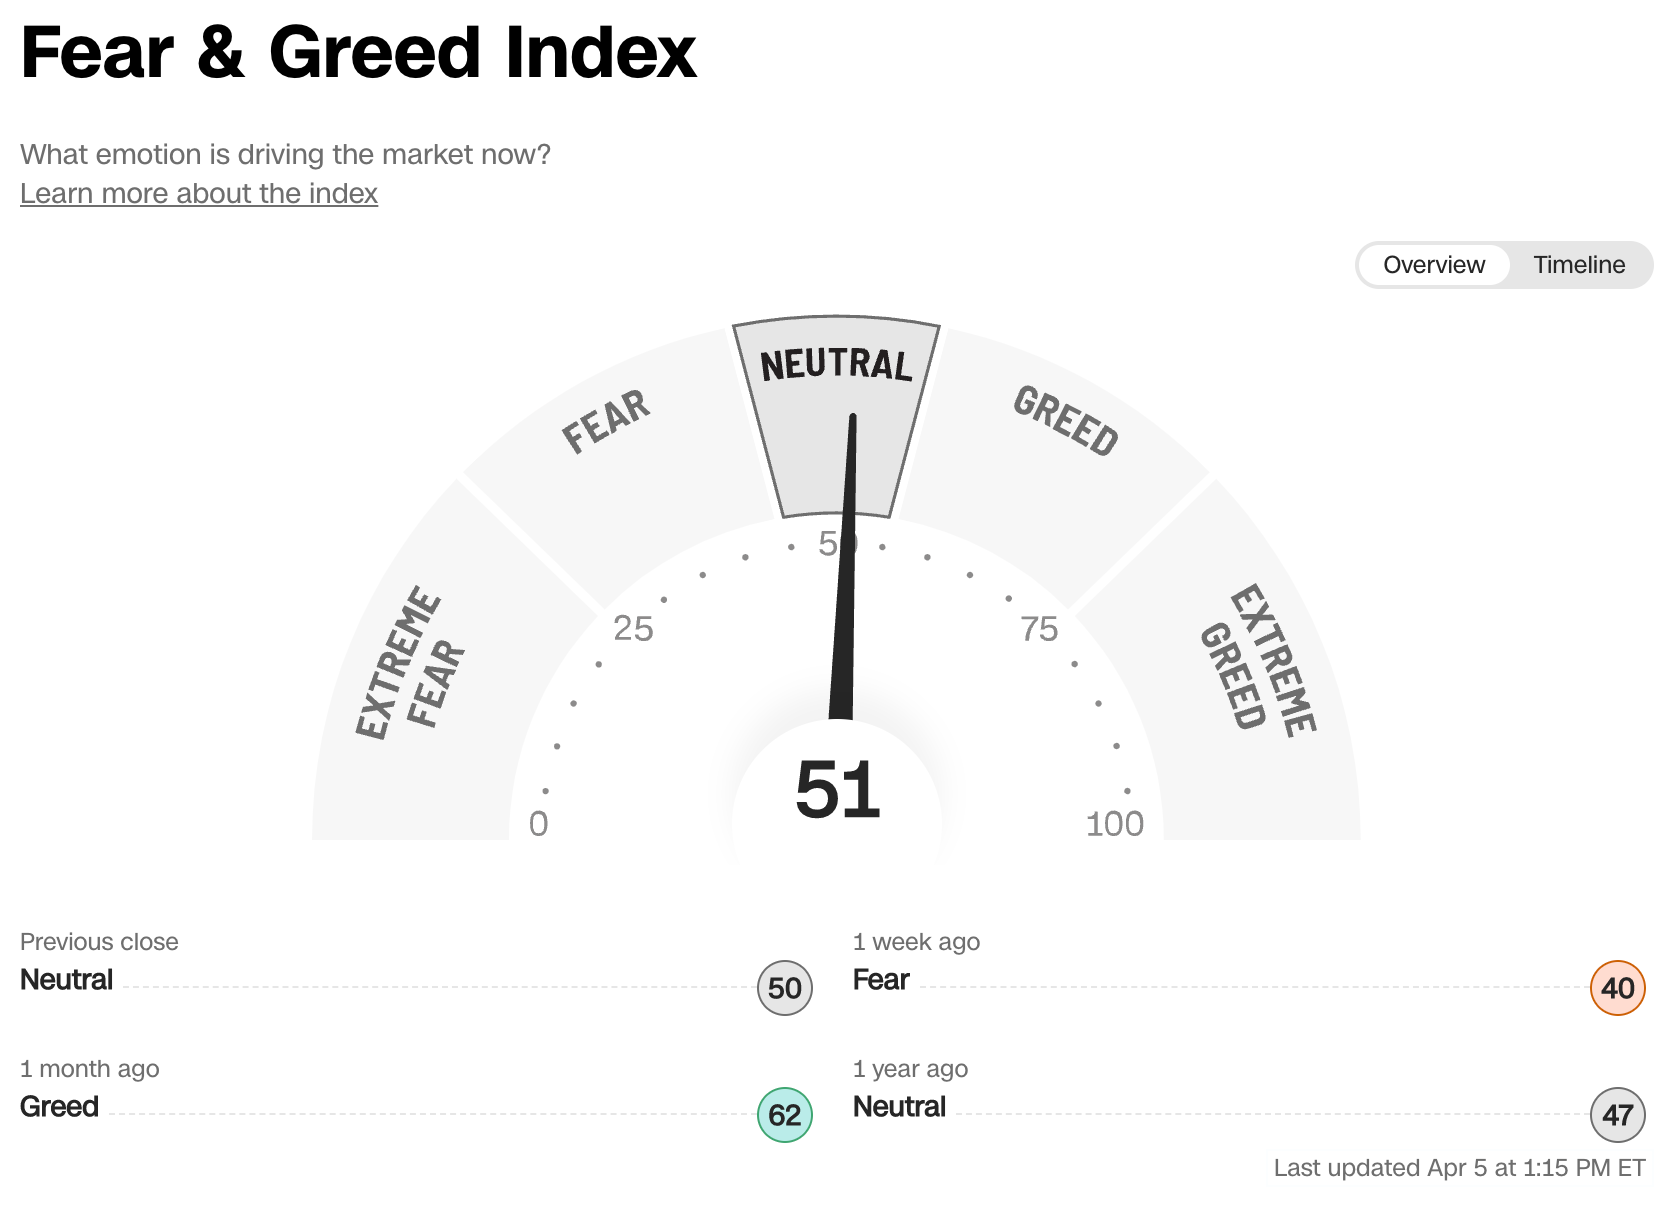
Sentiment Check
Make sure to check Larry’s most recent market updates via his personal newsletter.