Make sure to check out Interactive Brokers above as idle cash now will yield more than 4.5% as the Fed just raised rates.
Key Investing Resource: Strategist Larry uses Interactive Brokers as his core brokerage. Feel free to check out IB. I currently park excess cash at Interactive Brokers. Check it out. It’s a great brokerage.
In our emails, we will provide the following coverage points:
Short selling on individual US-listed stocks reached its highest level in six months, specifically in the tech, telecom, and media sector, which accounted for approximately 75% of the increase.
This trend comes in the wake of a significant 9% rise in the S&P 500 during the first quarter, which also saw the highest number of record closing highs since 2017.
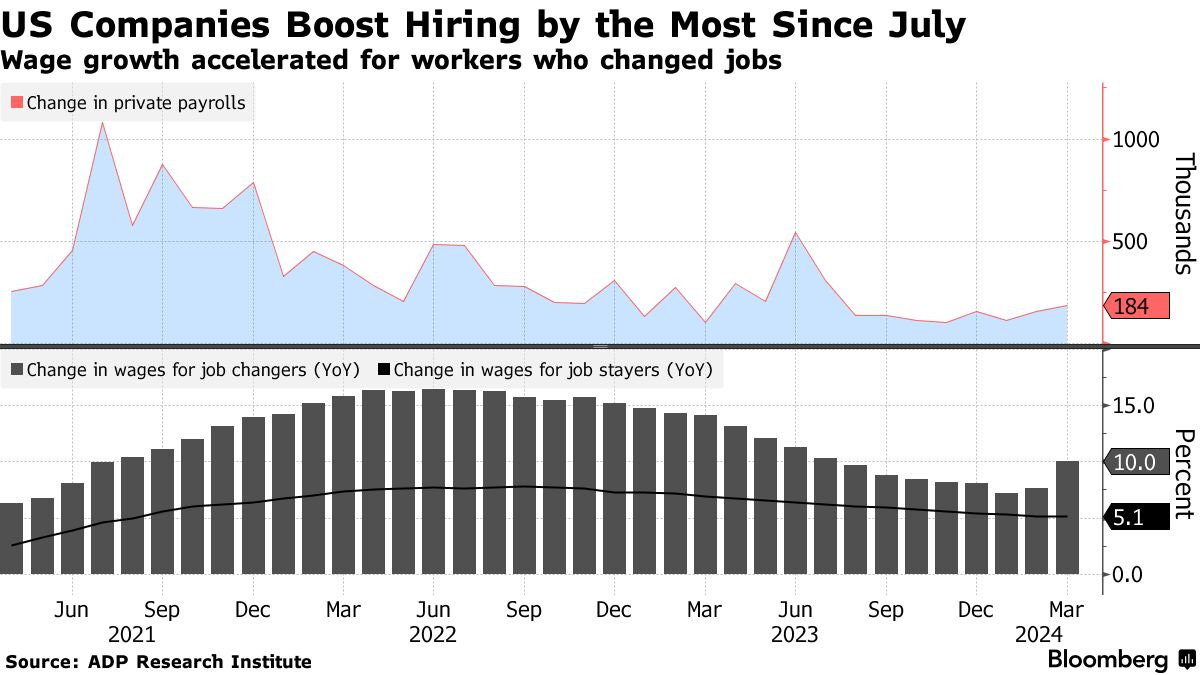
Macro Chart In Focus
Analyst Team Note:
US companies increased their hiring efforts in March, marking the largest growth since July, with private payrolls rising by 184,000.
Wage growth saw a notable acceleration, especially among job changers, with a 10% increase from the previous year, while workers who remained in their positions experienced a 5.1% median wage increase.
In March, growth in the US services sector slowed for the second consecutive month. At the same time, prices paid for materials and services fell to a four-year low, suggesting easing price pressures in the services sector.
Chart That Caught Our Eye
Analyst Team Note:
In Q4, corporate profits before taxes in the US reached $3.8 trillion on a seasonally adjusted annualized basis, marking a notable 16.5% increase for the quarter and a 7.5% rise YoY.
However, these figures include losses from Federal Reserve Banks, which amounted to $126 billion on an annualized basis during the same period. When these Fed losses are excluded, corporate profitability becomes more consistent, with profits having increased for nine consecutive quarters since a slight decline in the third quarter of 2021.
Sentiment Check
Make sure to check Larry’s most recent market updates via his personal newsletter.