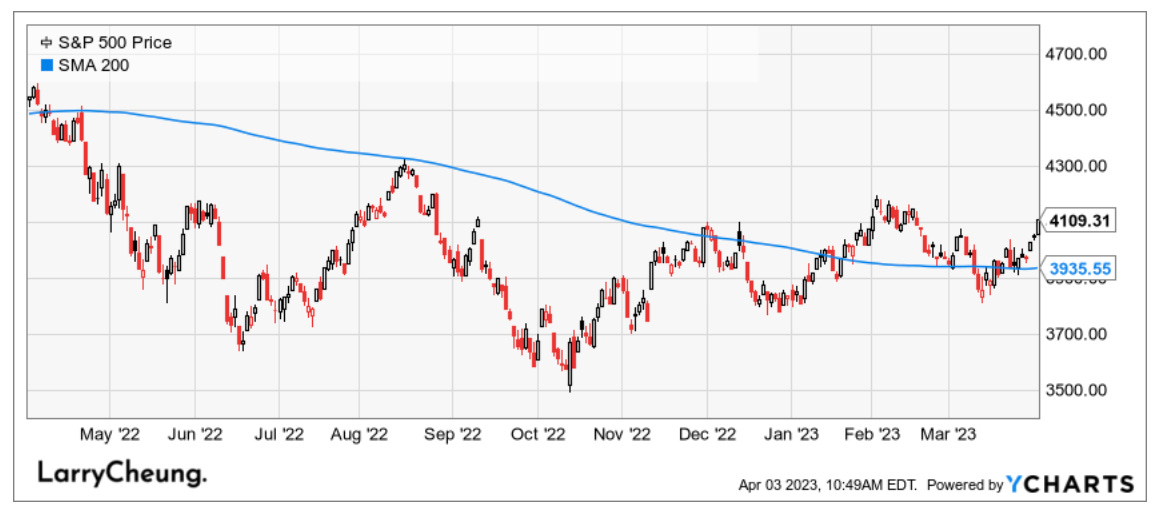
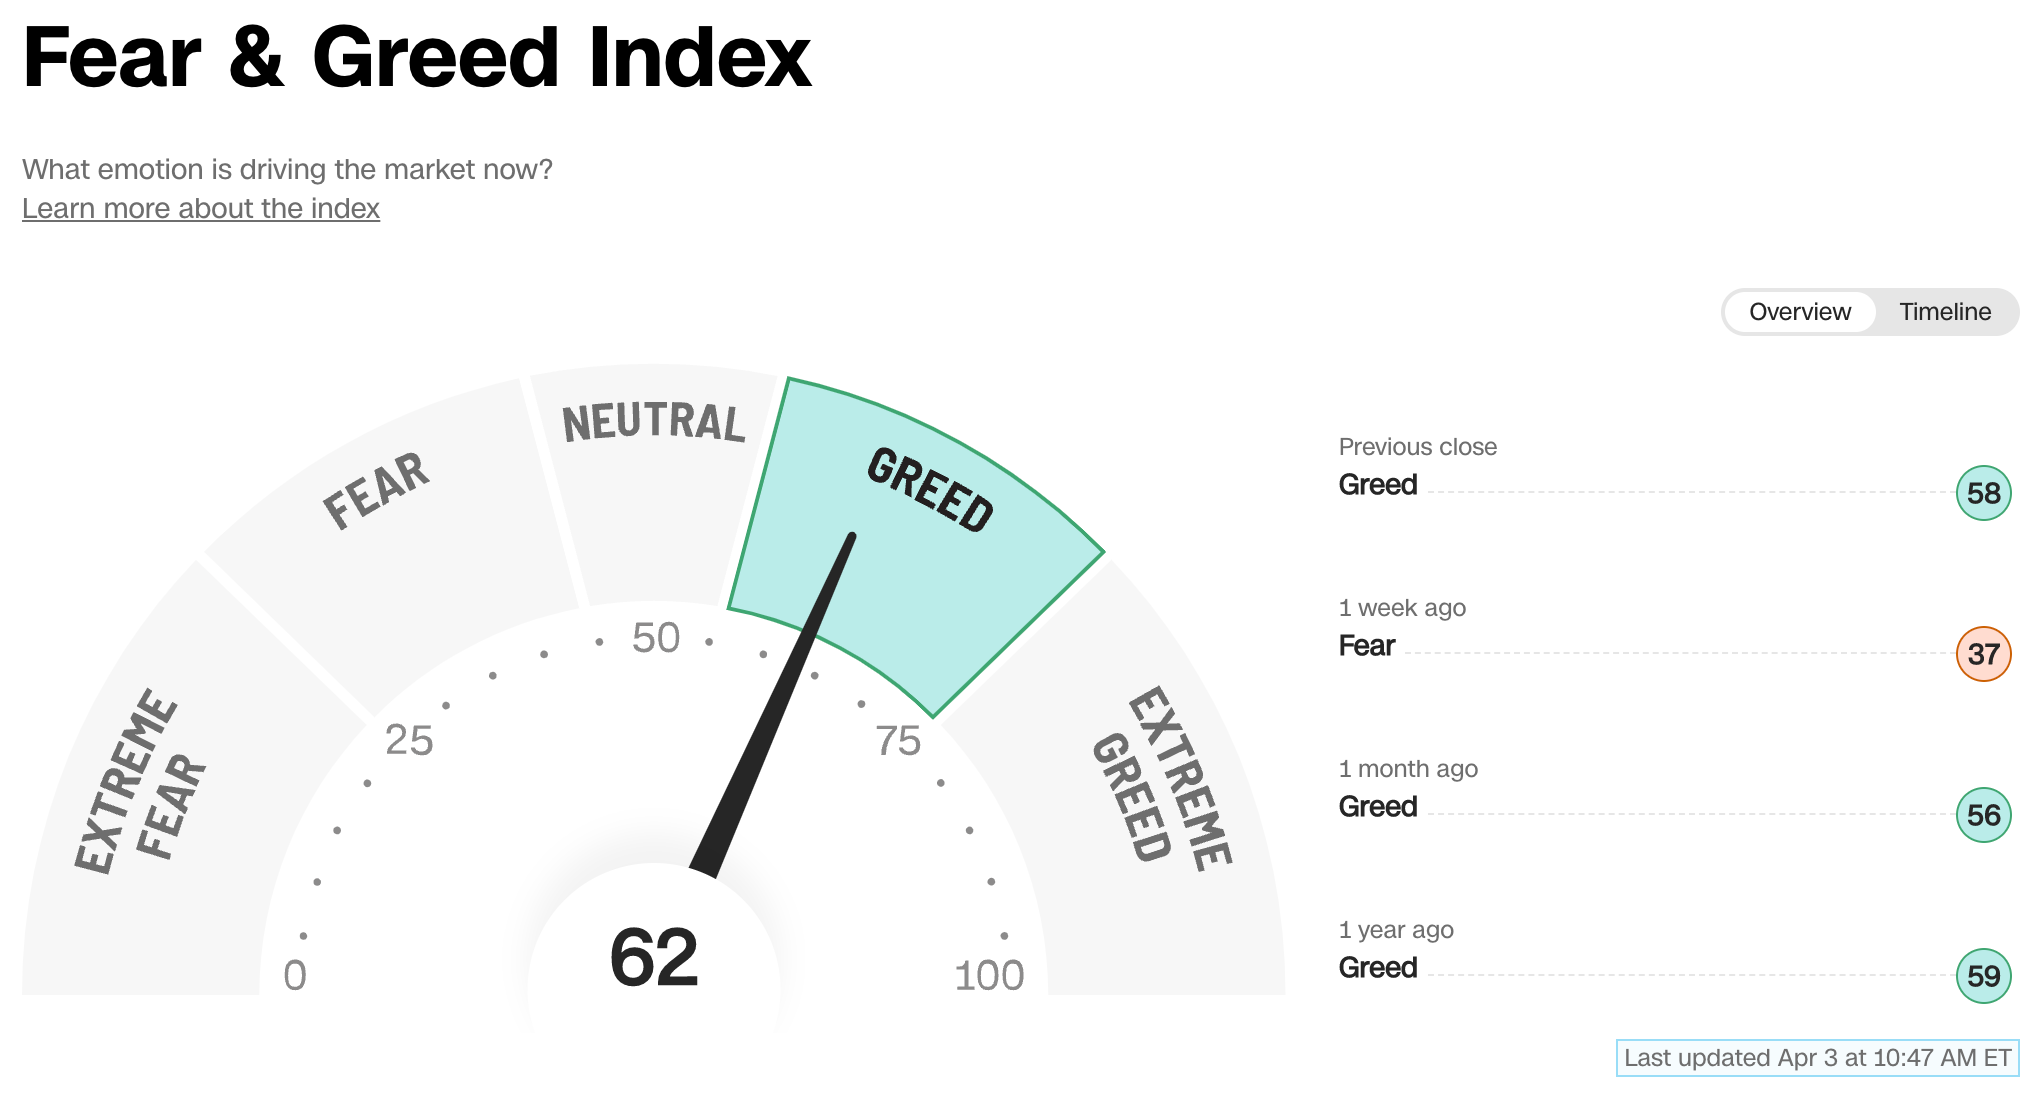
Markets continue behaving well as volatility has essentially collapsed to a VIX reading of ~18 as the Fear and Greed index moved from Extreme Fear to Greed in the span of 2 weeks. Price action is melting up higher ahead of a critical earnings season and stronger inflation catalysts (OPEC Oil Cut). We will soon find out which side in the market has Stronger Hands and whether this current action represents thoughtful Accumulation or Distribution.
Near-term positive momentum will soon have to answer to longer-term structural macro problems.
In the meantime, knowing which Zones favor whether being a Bull or a Bear would very much be advantageous. Understanding the landscaping, and knowing which themes/areas have “macro support” will give you greater conviction when volatility comes back. This is precisely what we discussed at great length in our April Investment Report (preview linked below).
Because when volatility does return, it will come back without a warning. And only those who have prepared ahead of time will be ready for the opportunities that present themselves.
Strategist Larry uses Interactive Brokers as his core brokerage. Feel free to check out IB. I currently park excess cash (yielding 4%+ on idle cash) at Interactive Brokers.
In our emails, we will provide the following coverage points:
Consensus earnings estimates were falling quite steadily during the 2nd half of 2022 but have since stabilized. A 220 SPX EPS implies an 18.7x earnings multiple.
The largest downward revisions have been in energy, tech, and healthcare. Which estimates haven’t moved that much? REITs.
Macro Chart In Focus
Analyst Team Note:
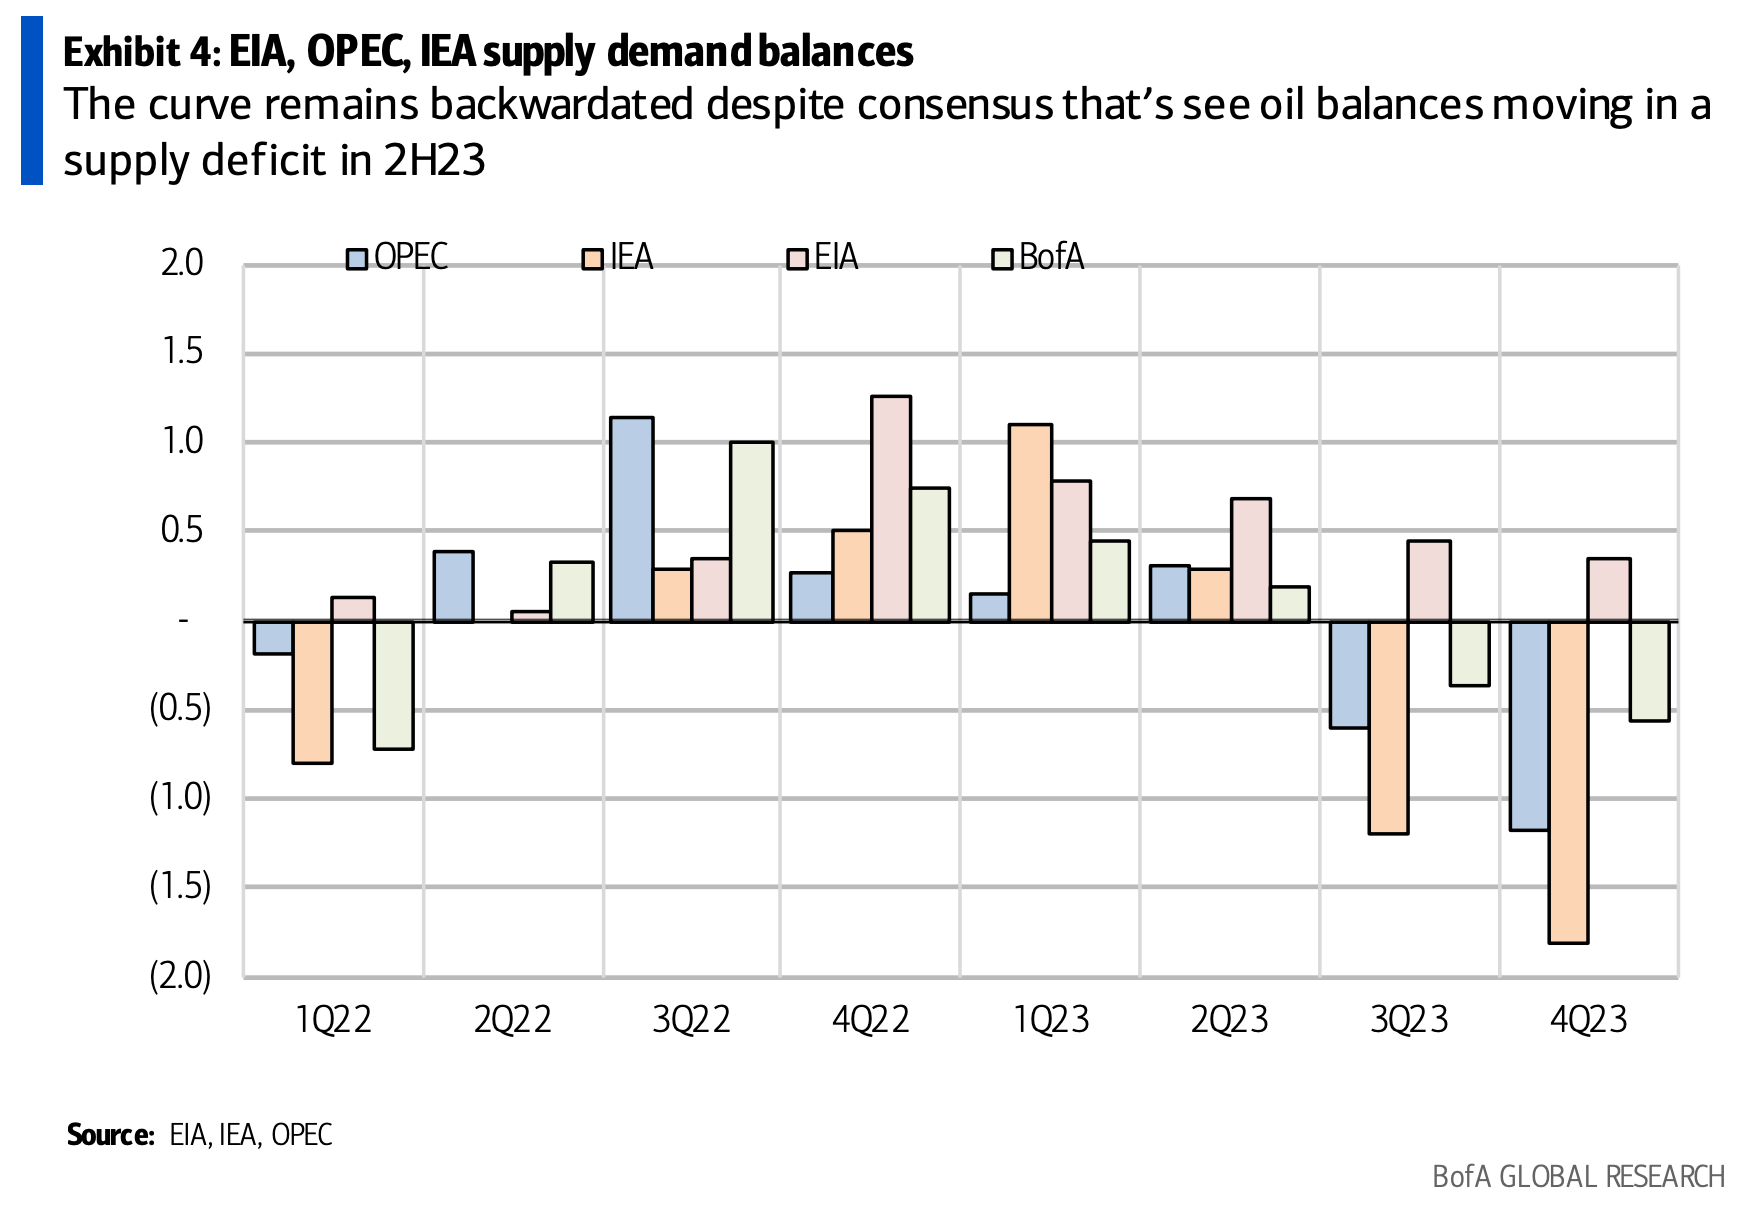
The recent surprise production cut by OPEC+ is set to eliminate the current oil supply surplus and push the global oil market into a deeper deficit later this year.
Prior to this intervention, global oil supply was predicted to exceed demand by about 500,000 barrels per day from April to June, before moving into a deficit due to China's post-pandemic demand recovery.
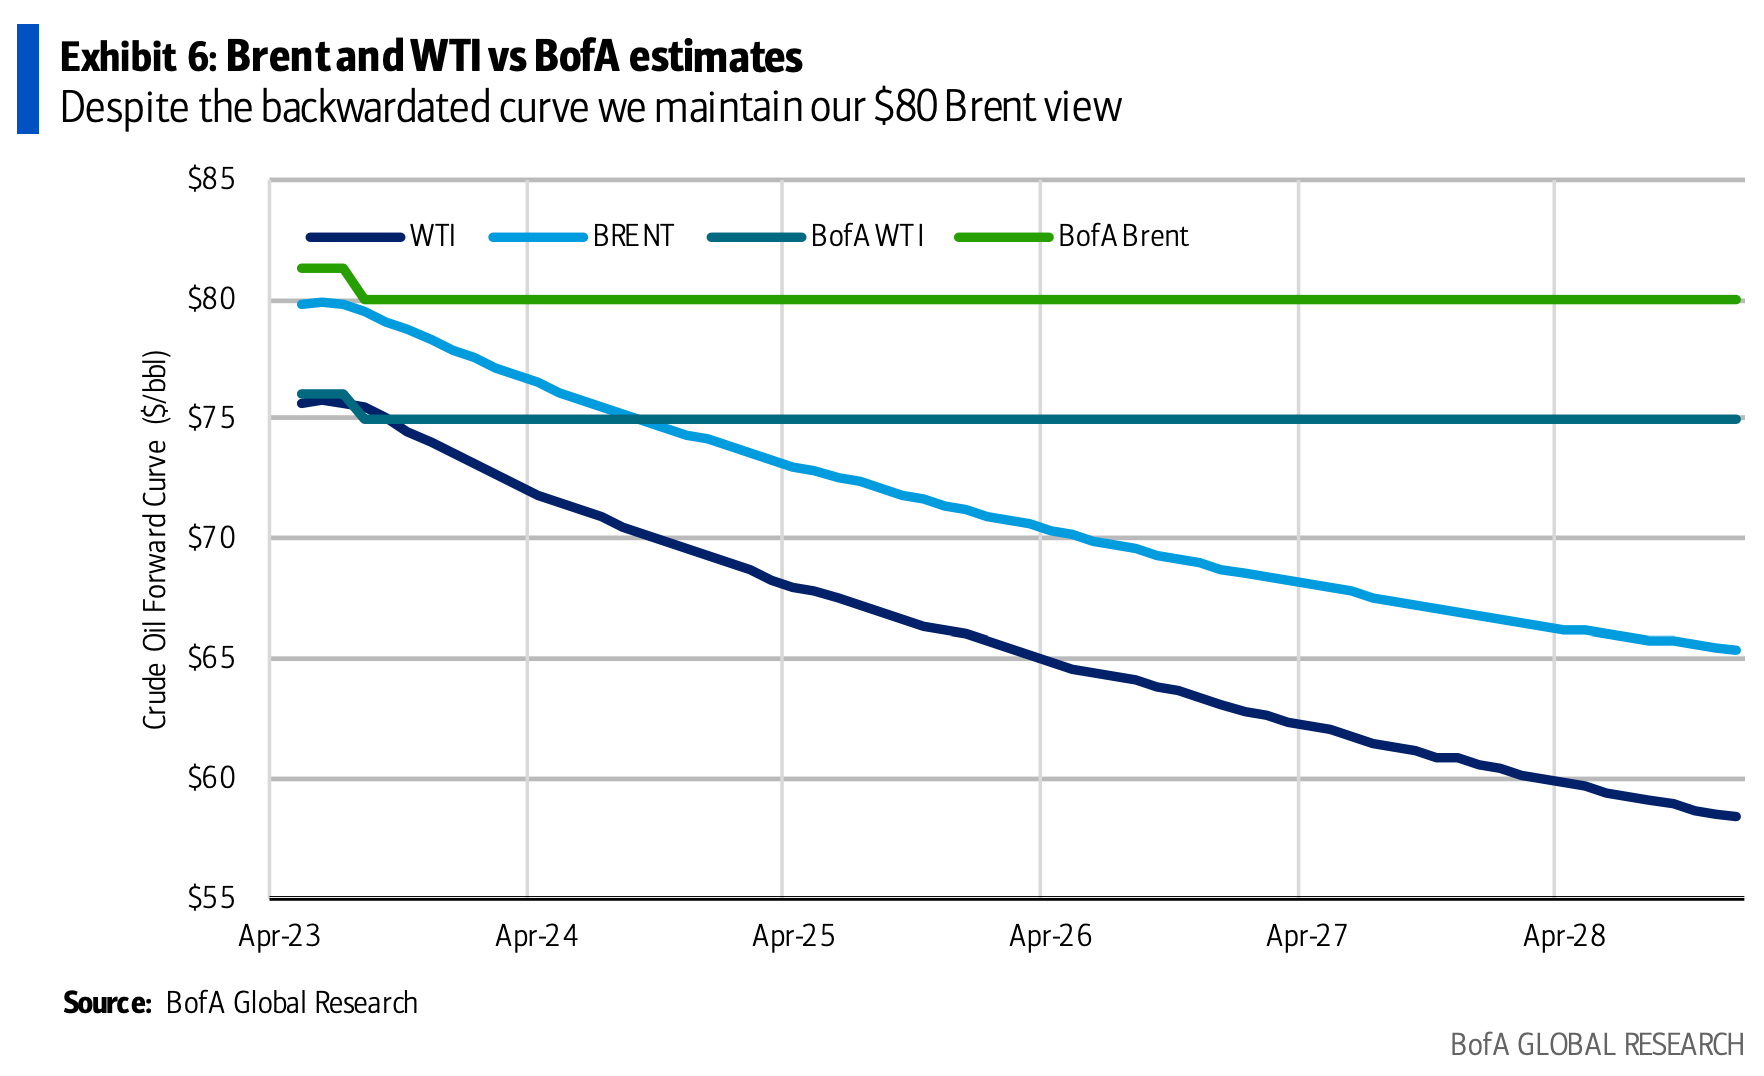
Despite this, there is still a backwardation in oil futures contracts. The prices of futures contracts for oil are lower in the more distant delivery months compared to the nearer delivery months. This indicates that the market expects future prices to be lower than the current spot price.
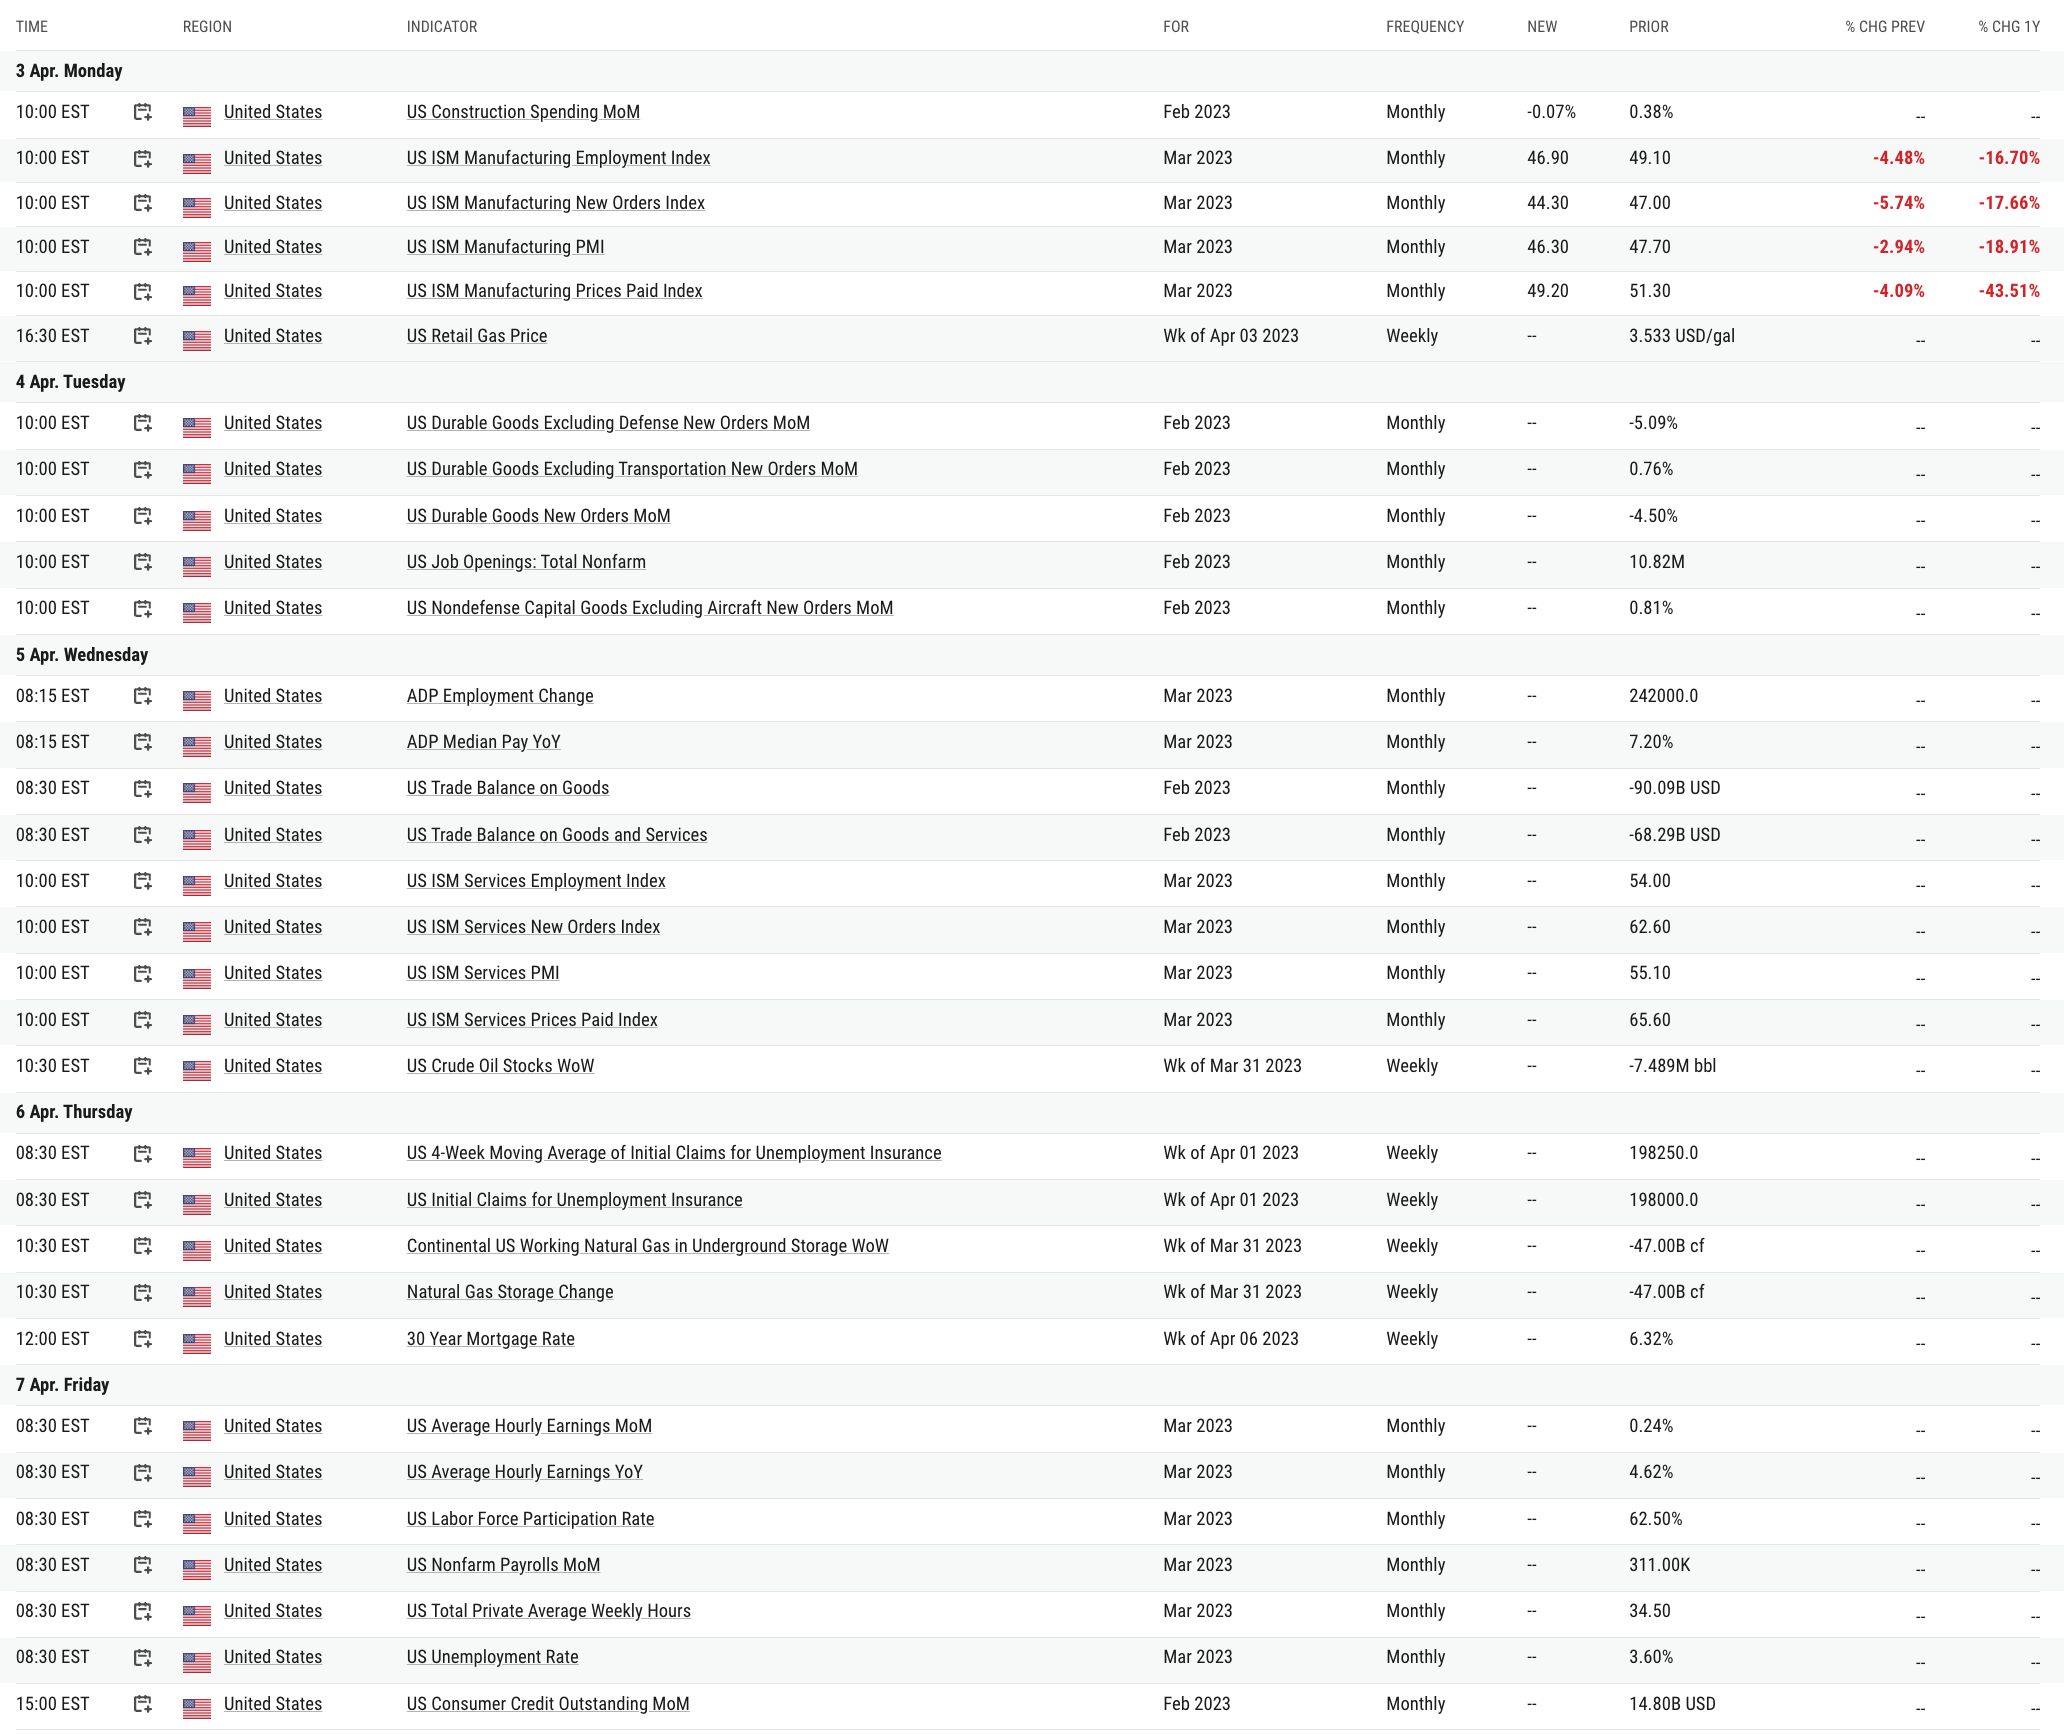
US factory activity in March declined more than anticipated, with a key indicator dropping to its lowest level since May 2020, as new orders and employment measures also decreased.
The ISM's gauge of manufacturing activity came in at 46.3 in March, lower than the expected 47.5 and indicative of contraction. The reading was the worst since 2009, excluding pandemic-related declines.
Panelists expressed concern about when manufacturing growth would resume, and while there was price instability, future demand was uncertain due to companies working through overdue deliveries and backlogs.
Chart That Caught Our Eye
Sentiment Check
Make sure to check Larry’s most recent market updates via his personal newsletter.