Note to Readers from Larry: Due to the large weights of the FAAMG stocks, the SPY and QQQ ETFs continue to hold up very well. Their equal weighted ETF peers RSP and QQQE are not faring nearly as well, and in the meantime, the cost to ensure against downside is rising with implied volatility now more sticky than it was just one week ago.
FAAMG stocks appear to be the location of safety while many individual stocks in the market and themes weaken further as demonstrated by soft breadth. China awaits its next catalyst, and commentary on these themes is included in my supplement note sent to members.
Key Investing Resource: Strategist Larry uses Interactive Brokers as his core brokerage. Feel free to check out IB. I currently park excess cash (yielding 4%+ on idle cash) at Interactive Brokers
In our emails, we will provide the following coverage points:
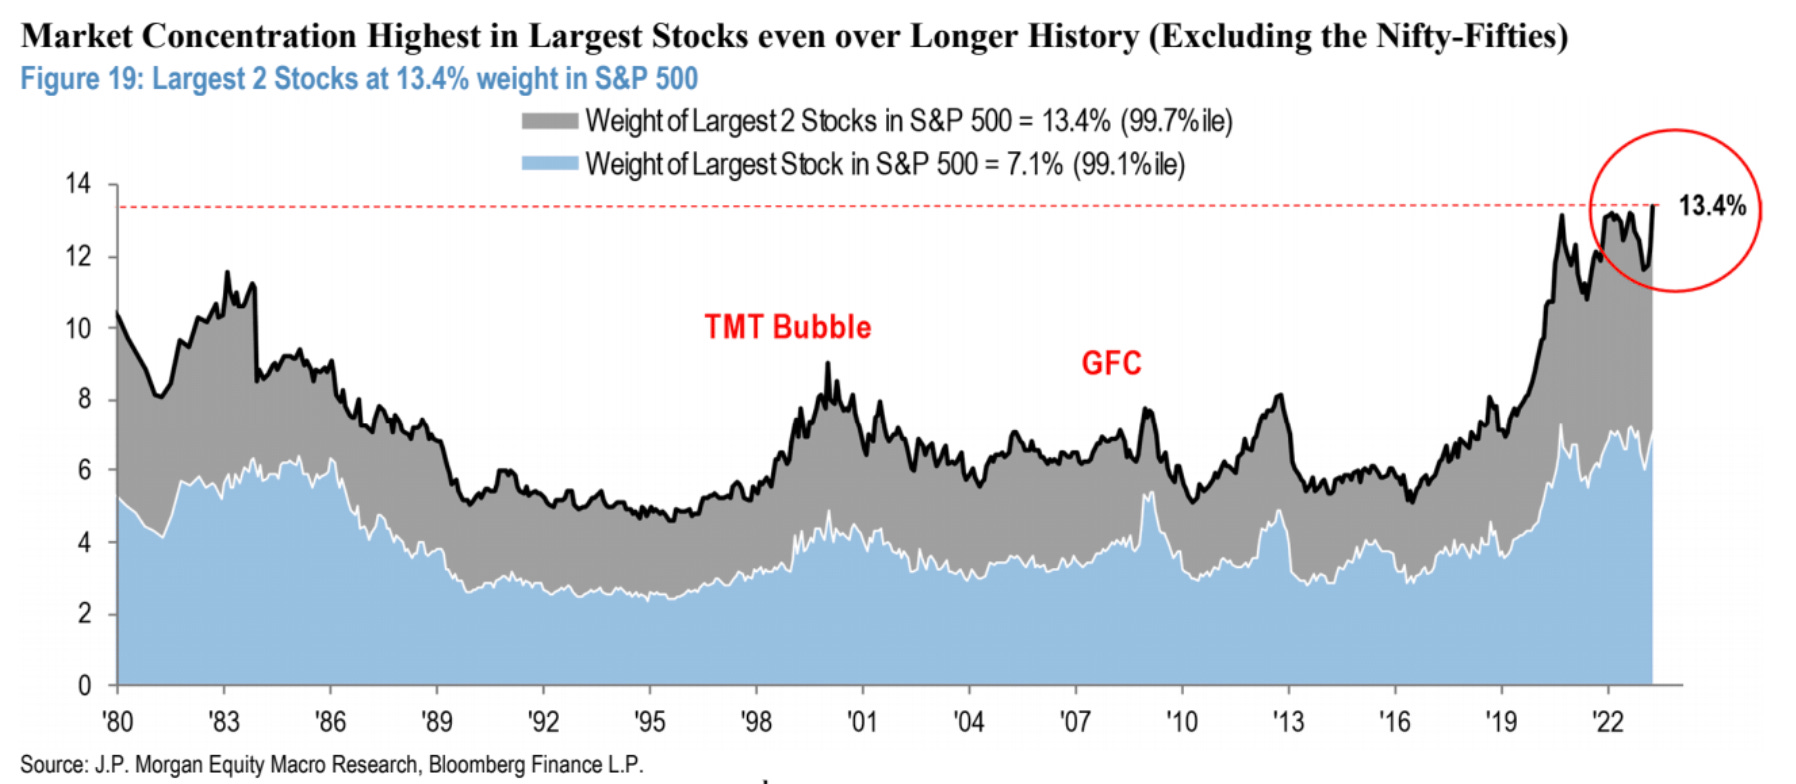
Market leadership has deteriorated, with the S&P 500 index heavily driven by a handful of names, specifically Apple and Microsoft, which together represent around 14% of the index weight. Over the past three months, these two companies contributed about one-third of the S&P 500's ~7.5% return. Mega-cap leadership has become extreme, as evidenced by the outperformance of market cap-weighted indices over equal-weighted versions for both the S&P 500 and Nasdaq 100.
If the economy slips into a recession, it’s likely that market concentration will broaden to include the next tranche of large-cap names, given their similar perceived safe-haven status and more attractive valuation.
In February, national home prices rose 0.2% month-over-month, marking the first recovery since June. On a year-over-year basis, home prices increased by 2.1%, down from January's 3.8% increase. The increase in existing home sales at the start of the year, coupled with limited supply, contributed to price declines. The recent housing data suggests that the housing sector is nearing a bottom, and low inventories due to the lock-in effect could provide a floor for prices.
Chart That Caught Our Eye
Analyst Team Note:
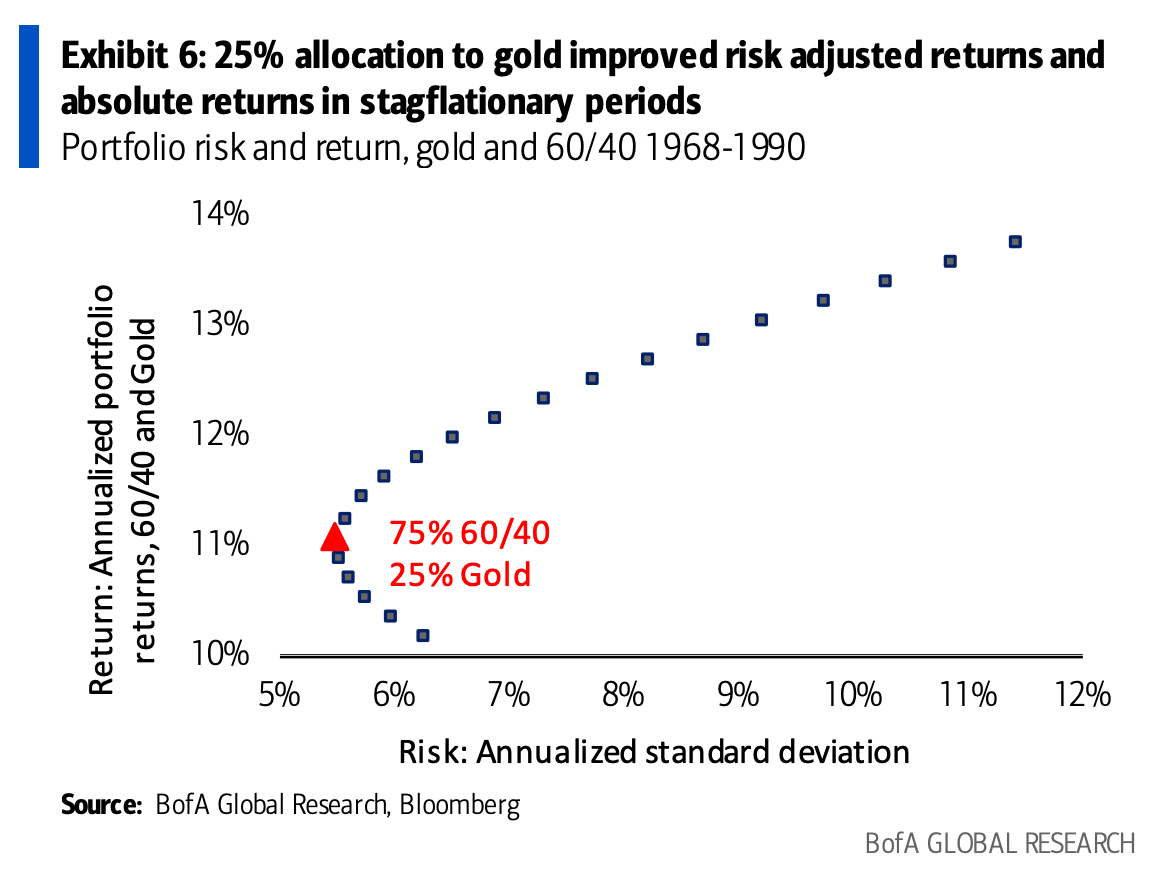
During the stagflationary, higher-rates period of the 1960s-1990s, a 25% gold allocation significantly improved portfolio performance. This enhancement occurred in three ways:
Lowering maximum drawdown, as a 25% gold allocation reduced the average maximum portfolio drawdown by 9% during the Dot Com Bubble, GFC, and Covid pandemic
Reducing volatility, as a 25% gold allocation lowered annualized downside deviation from 6.3% to 5.5% and increased annualized returns from 10% to 11.1%
Moving inversely to equities during market shocks, as gold prices rose when investors sought safety during market declines. The period from 1968-1990 witnessed large market declines due to the Fed's efforts to control inflation, with gold outperforming the S&P 500 during this time.
Sentiment Check
Make sure to check Larry’s most recent market updates via his personal newsletter.