4.25.24: Big GDP Miss in Q1 + Core PCE Accelerates
For Public Readers: Weekly Key U.S. and China brief market notes by Larry Cheung's Analyst Staff Team for our Public Email List

Make sure to check out Interactive Brokers above as idle cash now will yield more than 4.5% as the Fed just raised rates.
Key Investing Resource: Strategist Larry uses Interactive Brokers as his core brokerage. Feel free to check out IB. I currently park excess cash at Interactive Brokers. Check it out. It’s a great brokerage.
In our emails, we will provide the following coverage points:
Brief Overview of U.S. & China Markets
Macro Chart in Focus
U.S. & China Upcoming Economic Calendar
Chart That Caught Our Eye
U.S and China Markets Brief Snapshot 🇺🇸 🇨🇳
(Powered by our Channel Financial Data Provider YCharts)
S&P 500 Index: 5028.23
KWEB (Chinese Internet) ETF: $27.92
Analyst Team Note:
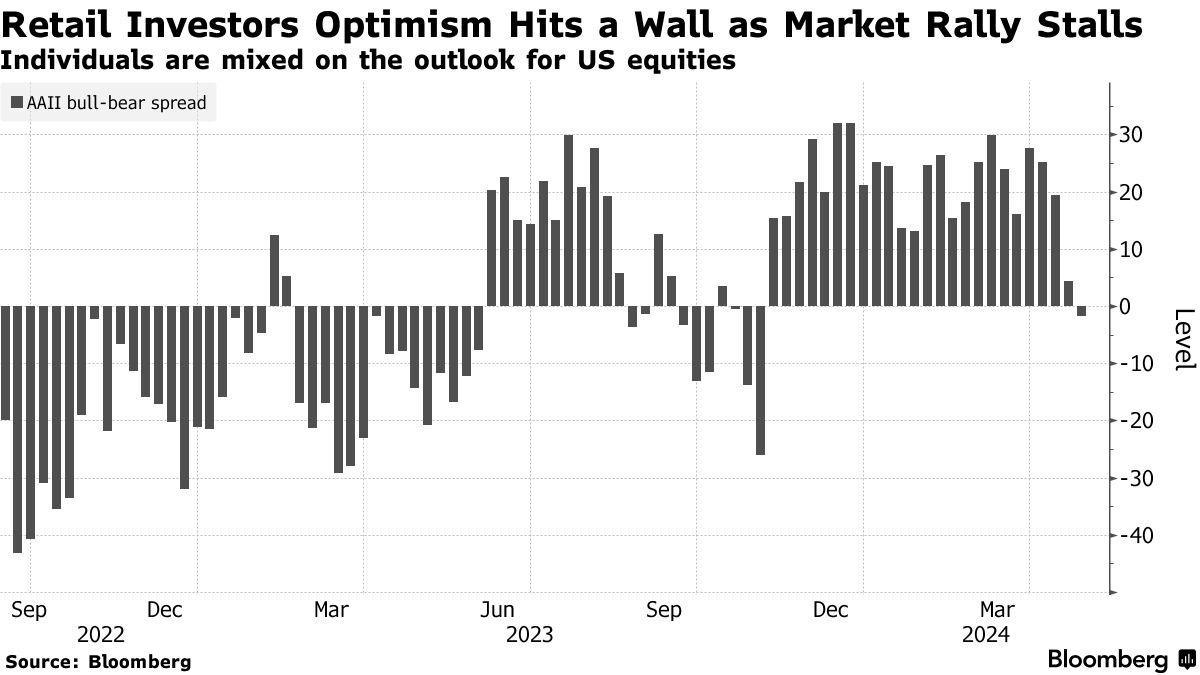
In April, individual investor sentiment turned negative for the first time since early November. While the percentage of bearish investors remained steady at about 34%, there was a notable shift towards neutrality and away from bullishness
Meanwhile, investment managers reduced their average equity exposure to 63%, the lowest since mid-January, according to the National Association of Active Investment Managers survey.
Macro Chart In Focus
Analyst Team Note:
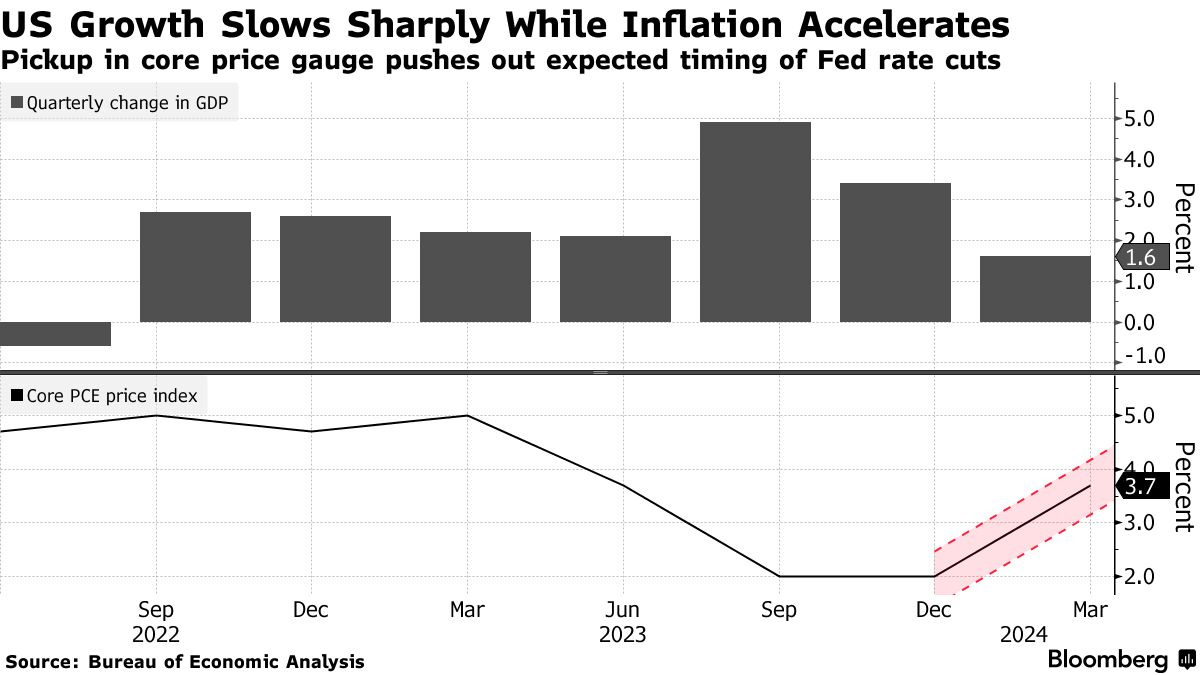
GDP last quarter increased at a 1.6% annualized rate, below all forecasts. Personal spending rose at a slower-than-forecast 2.5% pace.
Core PCE, the Fed’s preferred inflation indicator rose to 3.7%, the first quaterly acceleration in a year.
Upcoming Economic Calendar
(Powered by our Channel Financial Data Provider YCharts)
U.S Economic Calendar (Upcoming Data Points)
China Economic Calendar (Upcoming Data Points)
Analyst Team Note:
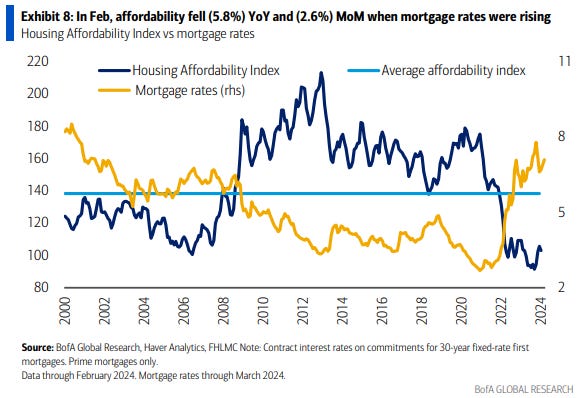
The Housing Affordability Index hit 103.0 in February, 26% below the historical average of 138.3.
March 2024 existing home sales fell to 4.19mm, compared to February sales of 4.38mm (-4.3% MoM), and decreased as compared to 4.35mm in March 2023 (-3.7% YoY).
March 2024 total existing home inventory increased to 1.11mm (+4.7% MoM) and rose +14.4% YoY on a monthly basis.
Chart That Caught Our Eye
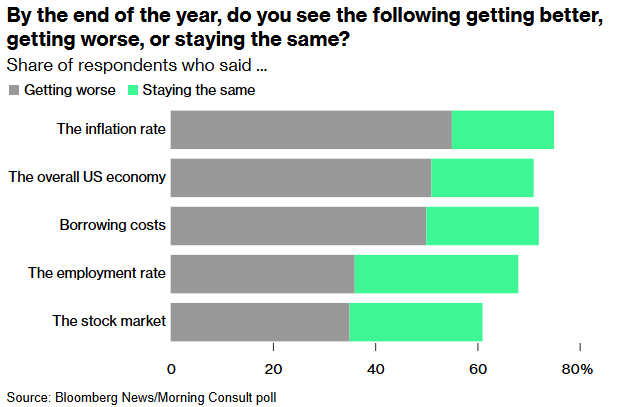
Sentiment Check
Make sure to check Larry’s most recent market updates via his personal newsletter.


