Note to Readers from Larry: Potentially due to seasonality flows,Market Bulls have shrugged off nearly every data point that suggests a weakening earnings outlook ahead.
However this buy-the-dip mentality will be put to the test as earnings season starts this week. I believe investors will begin to focus more on fundamental earnings as this will be the most important validation of whether the Index and other related names merit today’s valuation levels.
As we enter earnings season, the SPX trades near key resistance levels and the VIX trades near support levels. Waiting for Downside upon key levels is now a contrarian stance, but we believe the Patient will be sincerely rewarded.
Strategist Larry uses Interactive Brokers as his core brokerage. Feel free to check out IB. I currently park excess cash (yielding 4%+ on idle cash) at Interactive Brokers.
In our emails, we will provide the following coverage points:
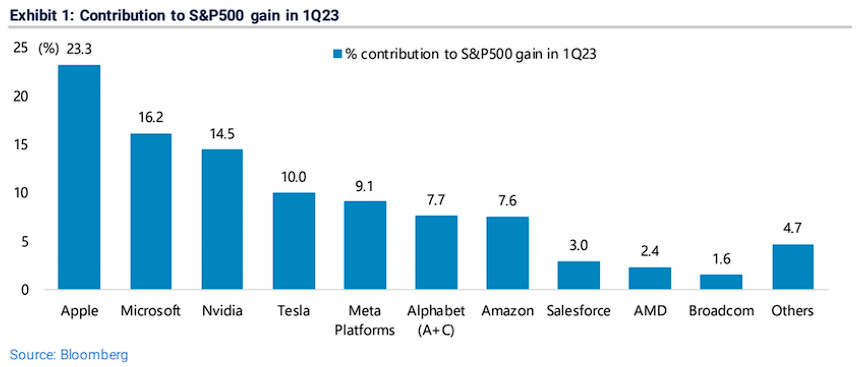
Last quarter’s US stock market rally can mainly be attributed to just three stocks: Apple, Nvidia and Microsoft, which contributed to 54% of the gains in the S&P 500. The top 10 stocks accounted for more than 95% of the gain.
Macro Chart In Focus
Analyst Team Note:
The MOVE index (a measure of bond volatility) is at the highest level relative to the VIX (S&P 500 volatility) since 2008. The creator of the MOVE index recently said that “It’s just a matter of time until the VIX picks up… Over the past thirty years we’ve seen large correlation between the shape of the yield curve, credit spreads an implied volatility – and I mean all the volatility measures including the VIX and MOVE. The whole pack of the risk metrics are very correlated over the long term.”
US banks have been tightening lending standards to small companies past few quarters. Credit crunch is likely to intensify and is highly correlateed with small business demand for workeers (US small businessees create 2/3 of US jobs).
Bank lending in the Eurozone has been tightening for a while now (3 months in a row). The $14 trillion Eurozone economy is highly dependent on bank credit (85% of corporates’ funding is channeled via bank loans).
Chart That Caught Our Eye
Analyst Team Note:
Came across a fascinating paper from Goldman Sachs on options strategies.
Income collected: Selling SPX 1-month calls has allowed investors to collect annual premiums of 0.4% to 24.4% over the past 27 years depending on the specific strike used from 100% to 115%. Investors have collected an annualized premium of 4.8% for selling a 5% out-of-the-money monthly calls over the 27 years and are on pace to collect 5.0% annualized in 2023.
Volatility reduction: Monthly call selling has reduced the volatility of an SPX portfolio by up to 80% depending on the specific strikes sold. Lower strike calls have a more negative beta and dampen the portfolio volatility by more than higher strike calls. Owning the S&P 500 and selling 5% out-of-the-money calls have had a volatility of 16.2% over the past 27 years vs the SPX volatility of 18.0%.
Total Return Impact: Selling 5% out-of-the-money SPX 1-month calls was profitable in 89% of months since January 1996; however, positive returns in these months were partially offset by losses in a small percentage of the months.
Risk-Return: The S&P 500 provided annualized returns of 9.2% since January expiration 1996 vs an annualized volatility of 18.2% (return/volatility ratio of 0.50). Owning the S&P 500 and overwriting with 5% out-of-the-money SPX monthly calls had a return of 9.6% with an annualized volatility of 16.2% (return/volatility ratio of 0.60).
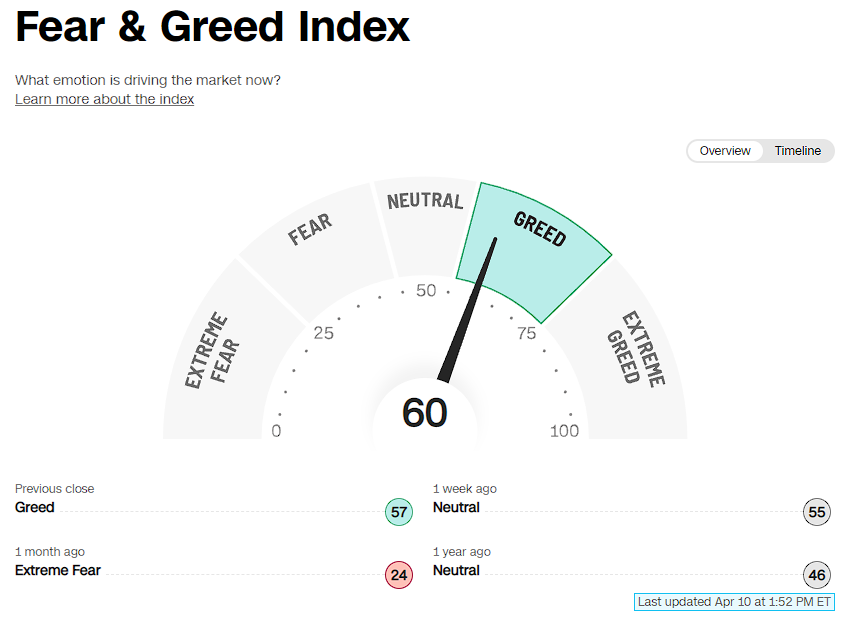
Sentiment Check
Make sure to check Larry’s most recent market updates via his personal newsletter.