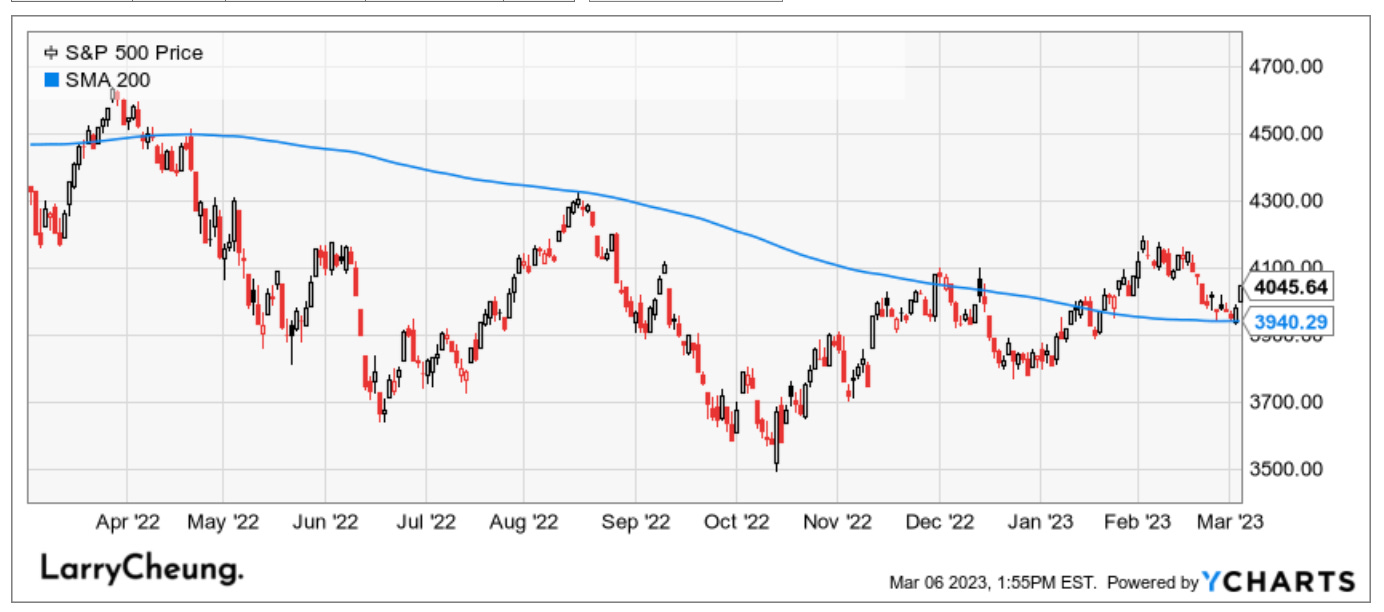
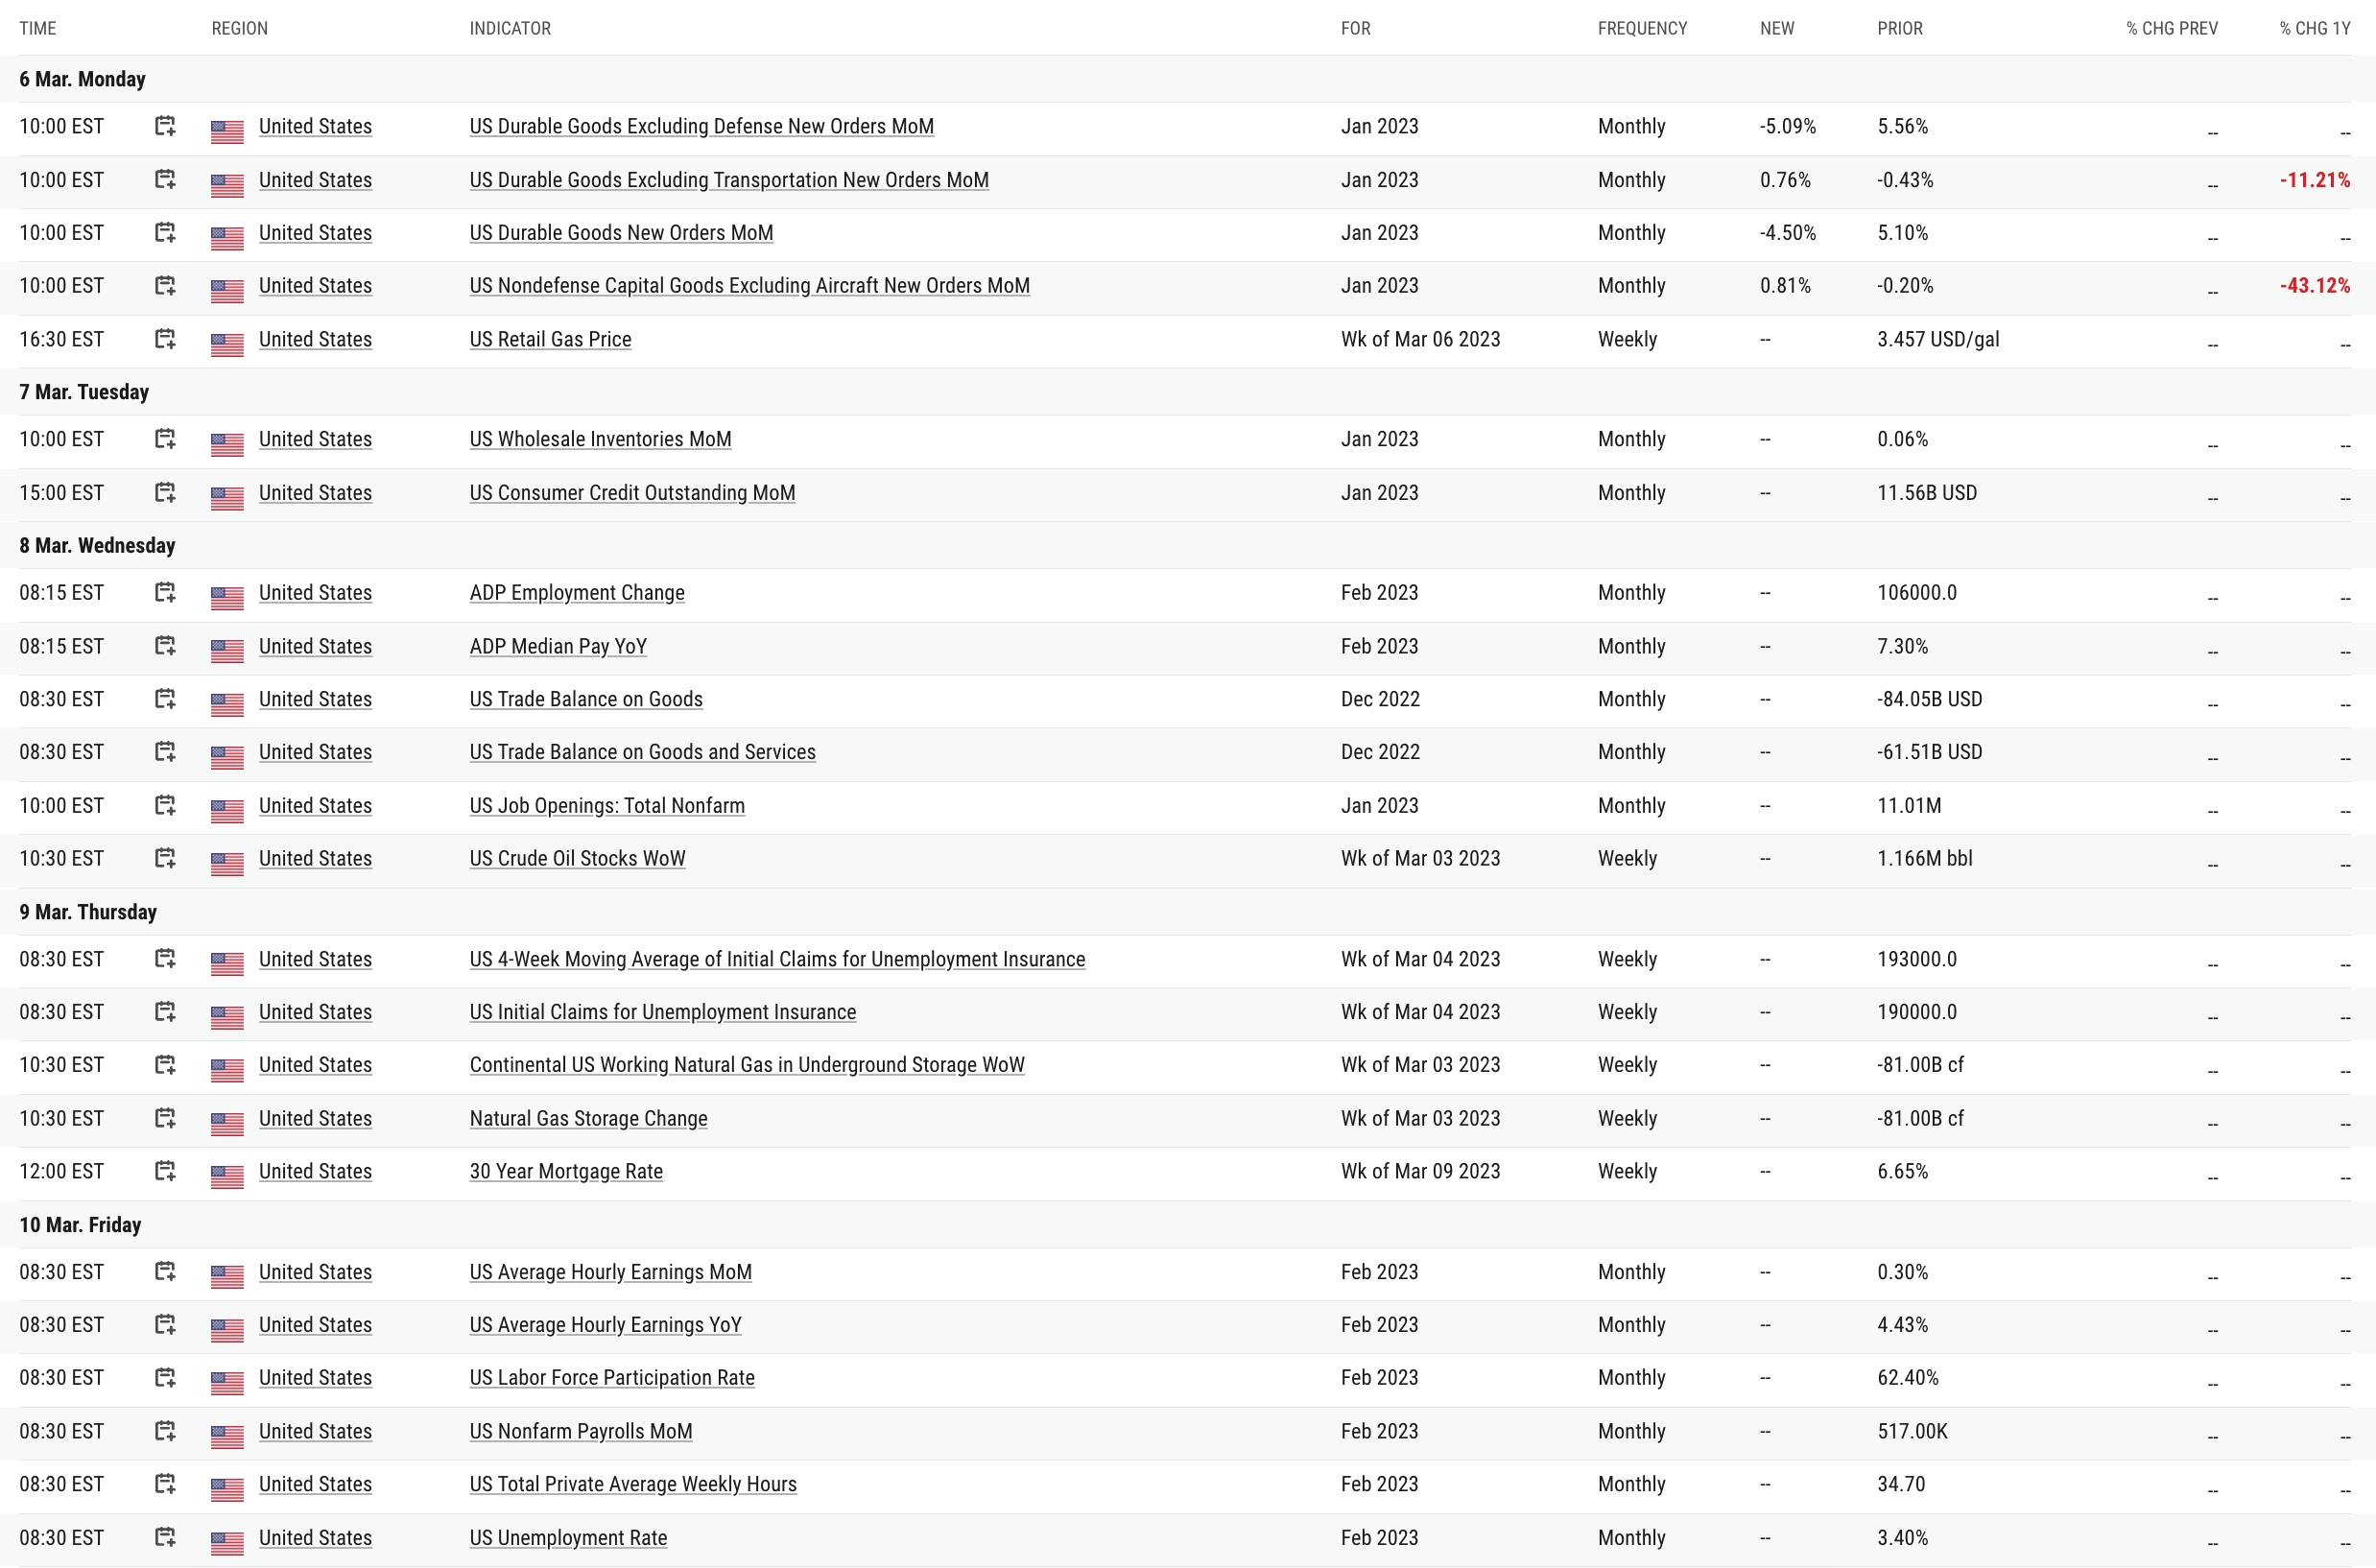
Note to Readers from Larry: We believe are still in the consolidating phase that we’ve guided for in my March note. Bigger moves will appear once we have more critical macro data points later this week. Plan accordingly in advance as once the trend starts, it may not be optimal to react to it then without a strategy.
Looking forward to helping the good folks navigate any traps that may be laid in the upcoming weeks with my latest Strategy note below.
Strategist Larry uses Interactive Brokers as his core brokerage. Feel free to check out IB. I currently park excess cash (yielding 4%) at Interactive Brokers.
In our emails, we will provide the following coverage points:
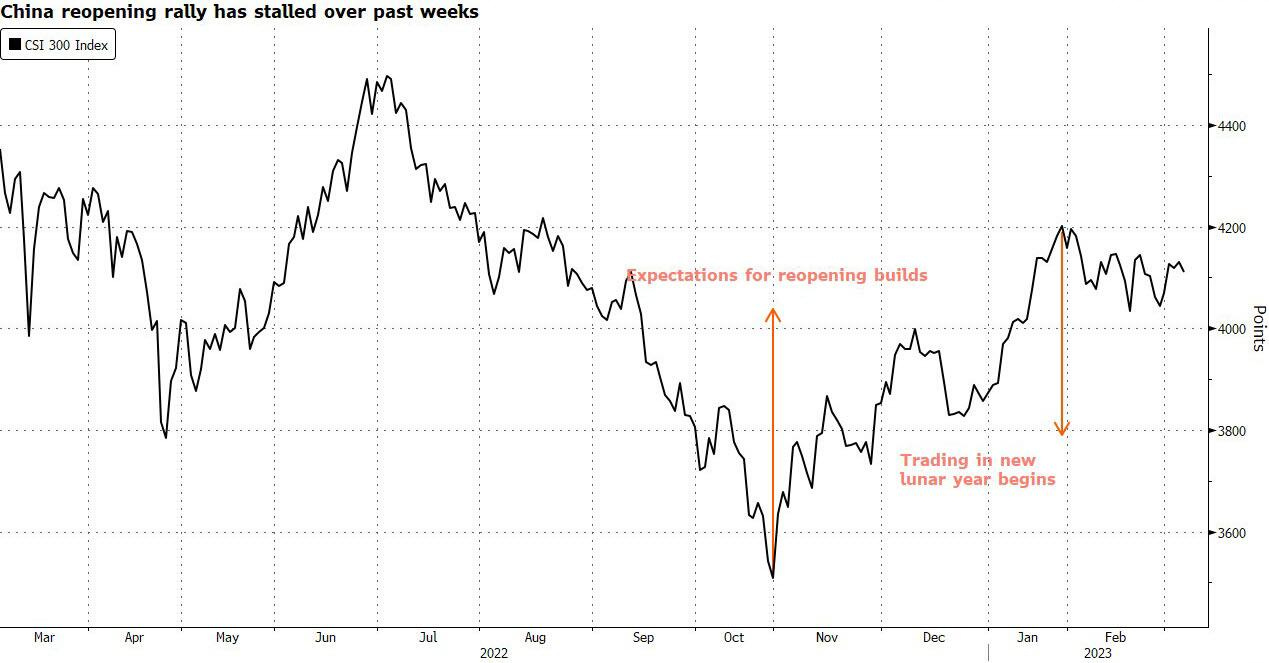
China's conservative economic growth target of around 5% for 2023, unveiled by Premier Li Keqiang at the National People's Congress, has dampened hopes for strong monetary or fiscal stimulus measures to boost the economy, including easing the property crisis.
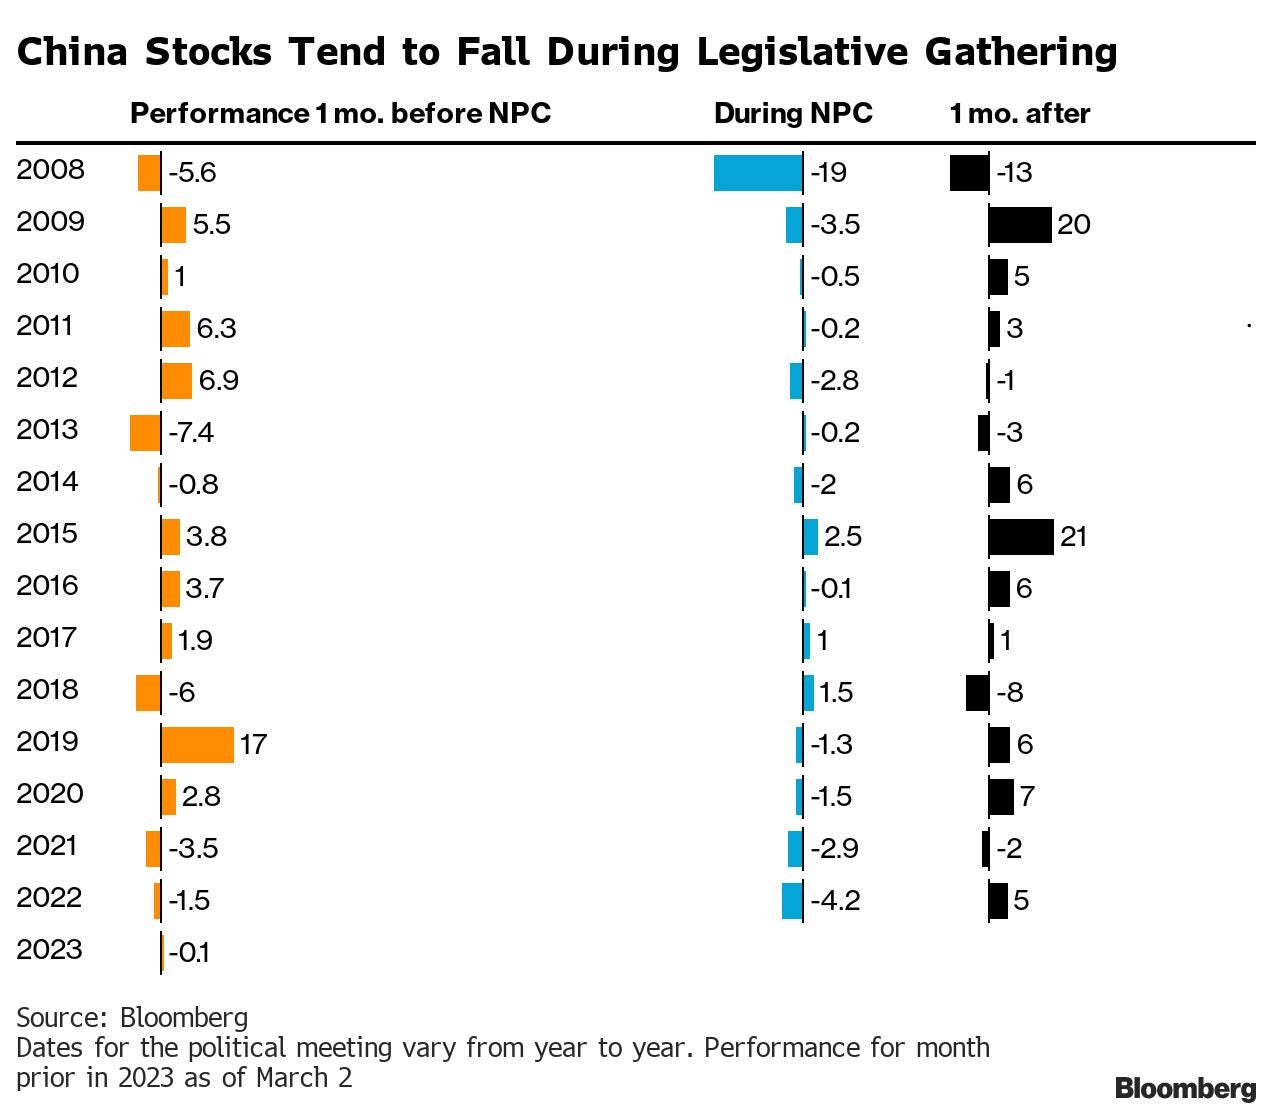
The absence of more aggressive steps to boost growth may weaken the momentum of the rebound in Chinese stocks seen last week. Beijing is expected to unveil a suite of structural changes for government agencies that will help the Communist Party consolidate its hold over the economy, which could reshape market sentiment in the coming days.
Macro Chart In Focus
Analyst Team Note:
At this point, we seem to discuss credit spreads every week. But it’s an important economic/market indicator that is on the top of our watchlist.
Despite tightening bank lending standards, HY credit spreads have not followed suit. In fact, since the Fed began raising rates in March 2022, HY spreads have stayed range-bound and there’s no sign of widening…
It’s quite puzzling as to why spreads haven’t blown out. As seen in the chart below, IG credit is only paying just 0.65% over the 6-month T-bill (which is yielding around 5.14%). Pretty strange for an economy that’s supposed to be ‘tighter’.
Lastly, I find it fascinating that while tech is a rate-sensitive sector, tech volatility (VXN) has disconnected from bond volatility (MOVE). Perhaps there is an opportunity here…
Since COVID, there has been a major disconnect between consumer sentiment and the unemployment rate. Perhaps, the consumer’s sentiment is now more closely tied to the equity markets than before.
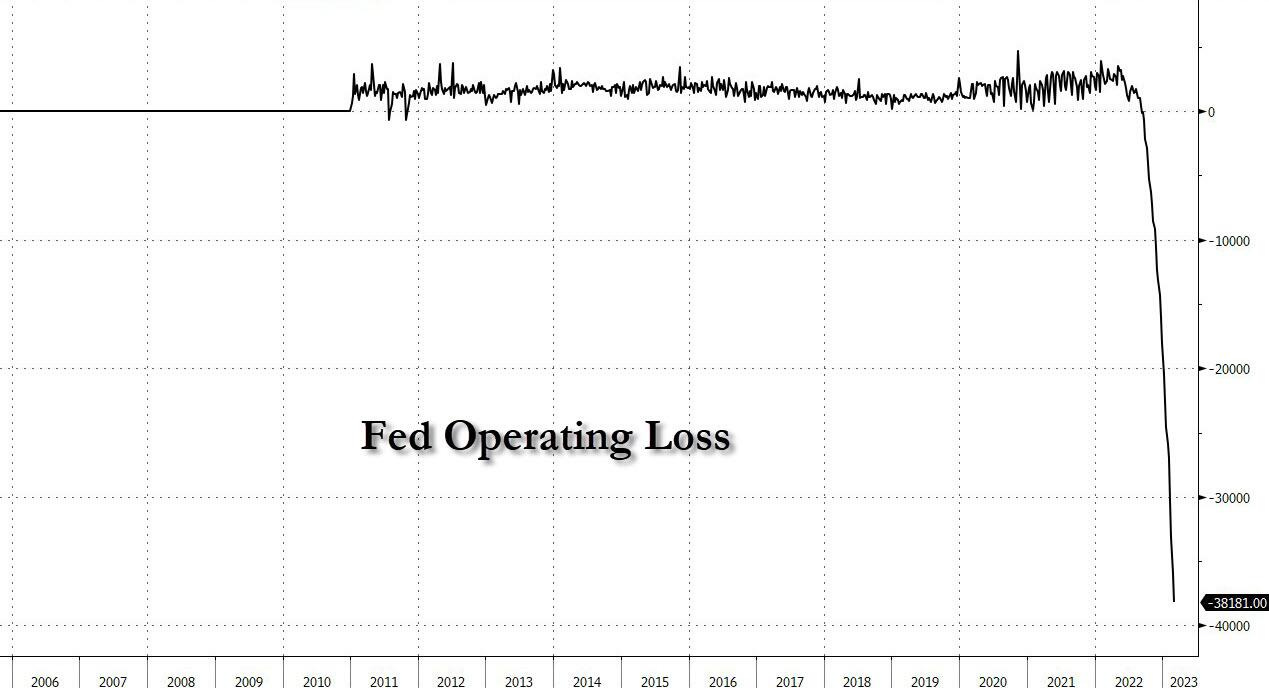
Chart That Caught Our Eye
Analyst Team Note:
The Federal Reserve System is on track to post its first annual operating loss since 1915, with an estimated loss of $80 billion or more in 2023 due to the rise in interest rates. This will impact the federal budget for several years, requiring new tax revenues to offset the loss of billions of dollars in the Fed's former remittances to the U.S. Treasury.
The Fed financed about $5 trillion in long-term, fixed-rate, low-yielding mortgage and Treasury securities with floating rate liabilities, which created a massive interest rate risk exposure that could generate mind-boggling losses if interest rates rose.