Note to Readers from Larry: This week has been beautiful as markets finally consolidate recent weakness with a nice Friday close to give Bulls a good weekend. Our opinion for first consolidation and then a potential recovery to 4050-4080 on the S&P 500 has materialized.
While we do believe the bigger market direction over the long-term in this macro environment is going to be lower, this doesn’t mean counter-trend rallies won’t occur. In fact, we discussed this in great detail in our March note.
We have now entered a contested zone of markets, where plenty of action is likely to happen next week. Join our Community and stay one step (or several steps) ahead of how market participants are positioning with our recent March Strategy note.
Strategist Larry uses Interactive Brokers as his core brokerage. Feel free to check out IB. I currently park excess cash (yielding 4%) at Interactive Brokers.
In our emails, we will provide the following coverage points:
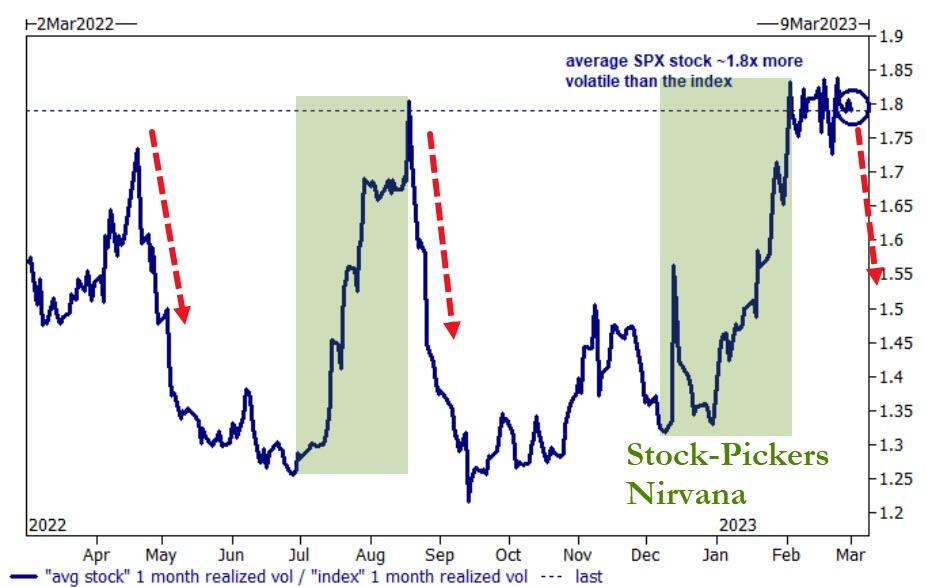
In 2023, stocks are behaving more independently, rather than moving in unison with market news. This was predicted earlier by Goldman, who noted that higher interest rates could create more opportunities for hedge funds to generate returns. As 4Q earnings reports are released, individual stocks are experiencing unique risks, resulting in greater volatility than the overall market. The average S&P 500 stock is currently 1.8 times as volatile as the index itself, reaching one-year highs.
However, the chart above is backward-looking - measuring the realized idiosyncratic moves relative to the realized index moves.
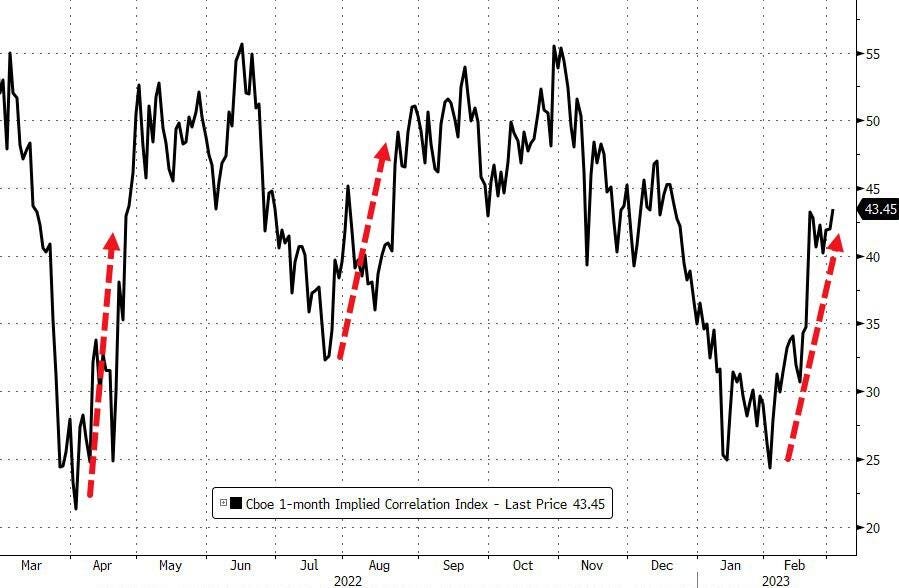
Looking ahead, the market is anticipating a shift towards macro-driven buying or selling pressure. Implied correlation for the S&P 500 over the next month has been increasing since February, indicating traders are expecting major event risk elements such as payrolls, CPI, and FOMC in the next three weeks to shift the equity market towards a "one trade" environment rather than the current stock-pickers' market.
Macro Chart In Focus
Analyst Team Note:
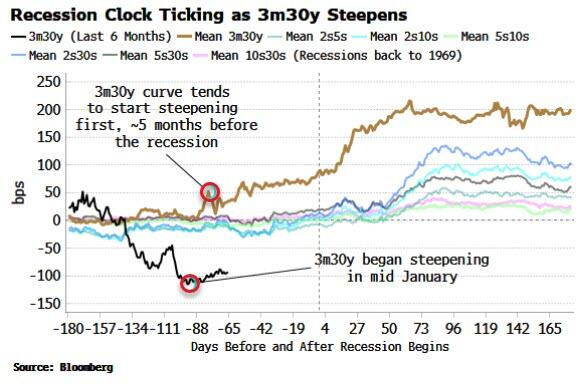
At least one key segment of the Treasuries yield curve suggests the US economy will enter a recession as early as June. The spread between 3-month and 30-year yields — typically the first part of the curve to steepen before a recession — continues to widen. This is a warning sign because inverted yield curves precede recessions, but it’s the re-steepening that signals the downturn is going to hit sooner rather than later.
Historically, the 3m30y yield curve has started steepening before a recession, beginning to rise about five months before its onset. It began in mid-January, which would put a downturn starting as early as June.
The rise in long-term yields is particularly troublesome this time because it suggests the bond market is beginning to price in structurally high inflation. The closely watched 2s10s curve is still inverting, recently hitting a new low.
Despite the ongoing headlines of layoffs across all industries, US jobless claims data continues to refuse to show anything but an extremely strong labor market, with initial claims at 190k last week (better than the 195k expected) and continuing claims at 1.655mn (below the 1.669mn expected).
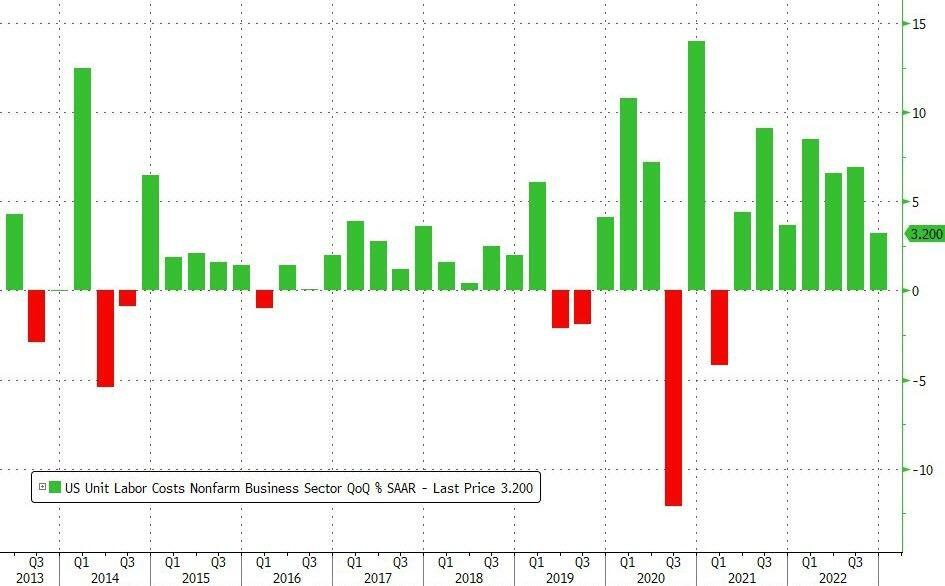
What makes it even worse for Powell is that unit labor costs for Q4 increased +3.2% QoQ (double the expected 1.6% rise),up for the 7th quarter in a row.
Chart That Caught Our Eye
Analyst Team Note:
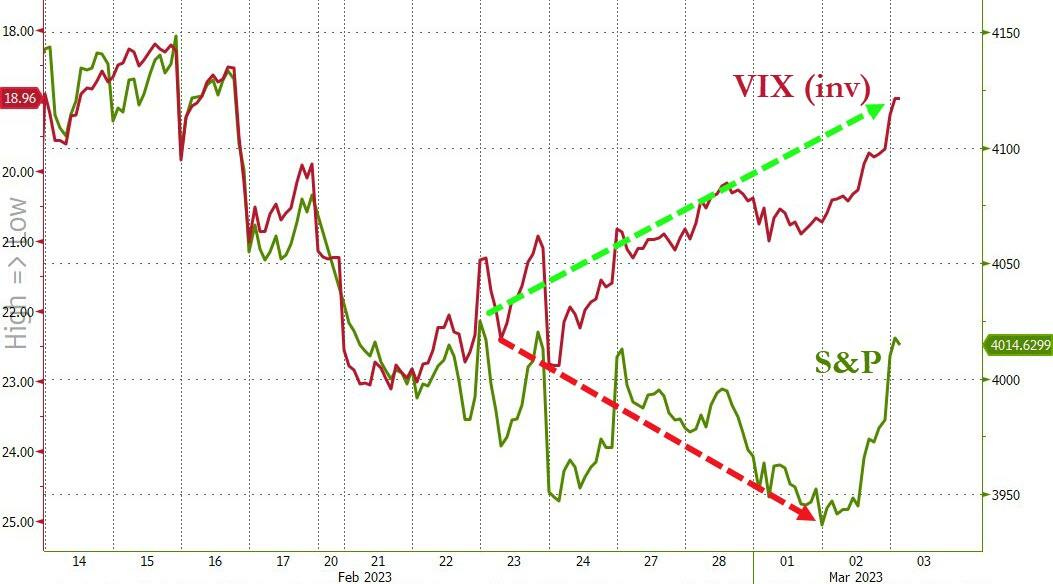
Recently, there’s been a decoupling in the negative correlation between the VIX and the S&P 500. This comes at a time when 0DTE options contracts, with shelf lives shorter than 24 hours, have exploded since mid-2022 to as much as 50% of trading volume, at times causing volatile moves in the underlying assets.
So why is the VIX decoupling from its traditional relationship with the S&P 500?
The VIX is the market’s expectations for volatility over the coming 30 days and only takes options expiring in 23 to 37 days from the present as inputs. This means that almost 50% of options trading volume is currently not being accounted for in the VIX calculation.
While the VIX may be historically useful as a hedging tool, we caution readers against using it for future hedging as it may not deliver the results you are expecting.