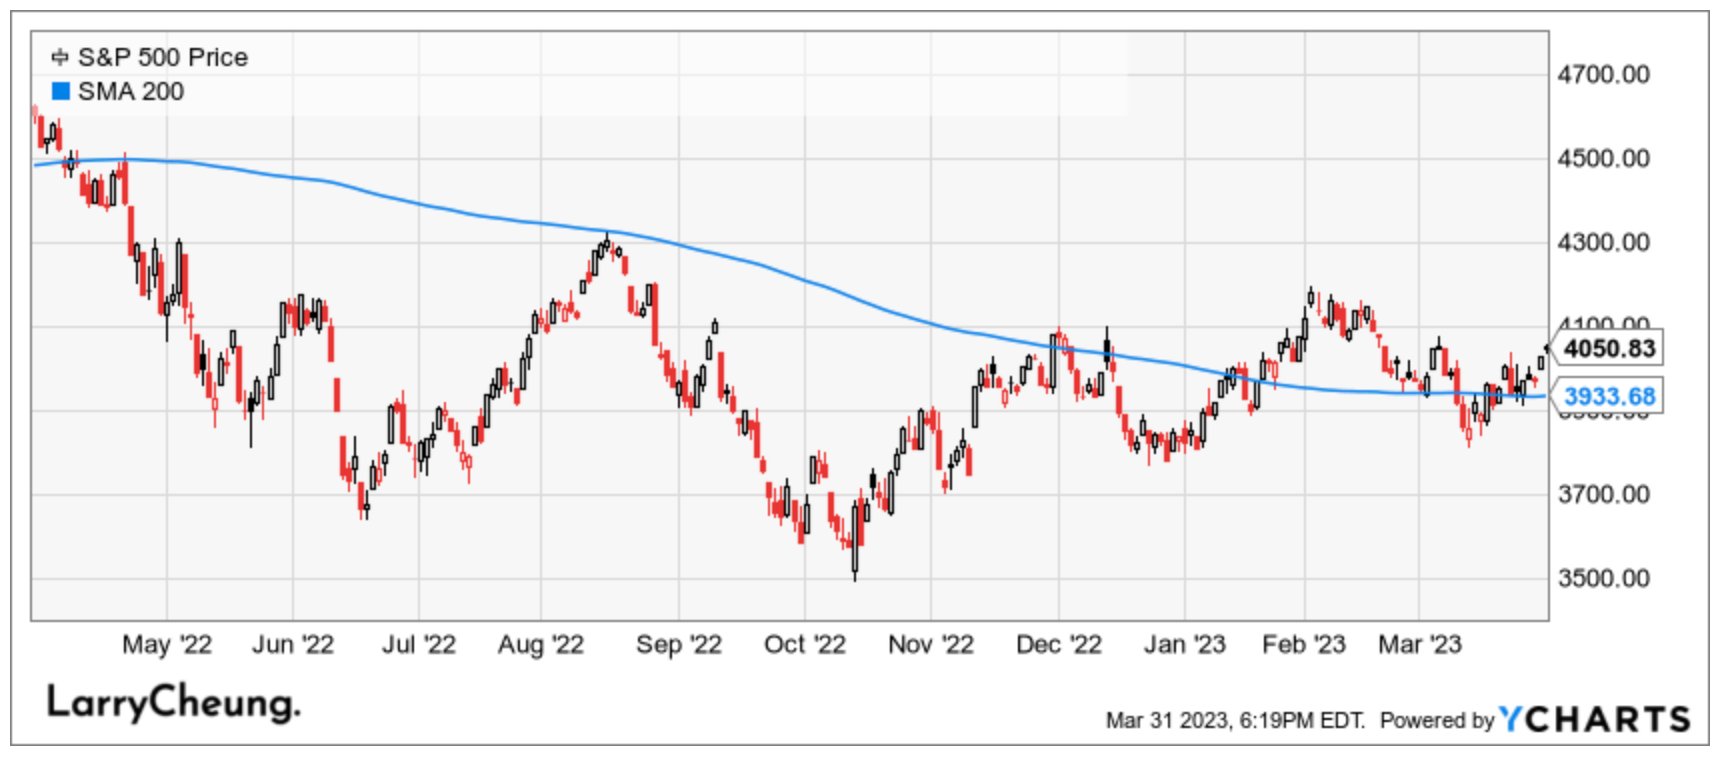
Note to Public Readers from Larry: The S&P 500 has soared from 3900 to 4100 after March FOMC, which is welcome news to Investors who have been waiting for equity prices to recover.
The market will find every possible way to take out both Bulls and Bears who have “weak hands” (meaning their entries are far too late along the directional trend).
I will discuss this more in detail in my April Investment Strategy to be released inside my private Substack/Patreon Community this weekend.
Let’s just say that I think it would be wise to prepare for what’s coming ahead. You will not want to miss my next update. Stay tuned. Join us - get prepared. Be equipped with plans.
Strategist Larry uses Interactive Brokers as his core brokerage. Feel free to check out IB. I currently park excess cash (yielding 4%+ on idle cash) at Interactive Brokers.
In our emails, we will provide the following coverage points:
Dash for cash continues…$60.1bn this week, >$100bn past two weeks; $508bn inflow to cash in Q1-23, largest quarterly inflow since Q1-20
IG bonds…4-week flows turning negative for the 1st time since Nov’22
EM…strong YTD inflows to EM equities: $37.4bn YTD inflows = $152.3bn annualized, which would be largest ever if inflows continue at this pace; as a % of AUM: 2.52% YTD = 10.3% YTD annualized, highest since 2010 (14.7% )
Tech…inflows continue for the 6th week (longest streak since Apr’22)
Financials…largest outflow in 10 weeks ($0.6bn)
Consumer…largest inflow in 11 weeks ($0.7bn).
Source: BofA
Macro Chart In Focus
Analyst Team Note:
Banks have decreased their loans from two Federal Reserve emergency lending facilities in the most recent week, suggesting that the demand for liquidity may be reaching a more stable level. US banks collectively had $152.6 billion in outstanding loans for the week ending March 29, down from $163.9 billion the week before.
The data from the Fed also revealed that $88.2 billion was borrowed through the Fed's conventional emergency lending program, known as the discount window. This is lower than the $110.2 billion borrowed the previous week and the record $152.9 billion borrowed during a time of banking distress earlier this month.
Outstanding loans from the Bank Term Funding Program (BTFP) were at $64.4 billion, up from $53.7 billion the week before. The BTFP was initiated on March 12 after the Federal Reserve declared a state of emergency due to the collapse of California's Silicon Valley Bank and New York's Signature Bank.
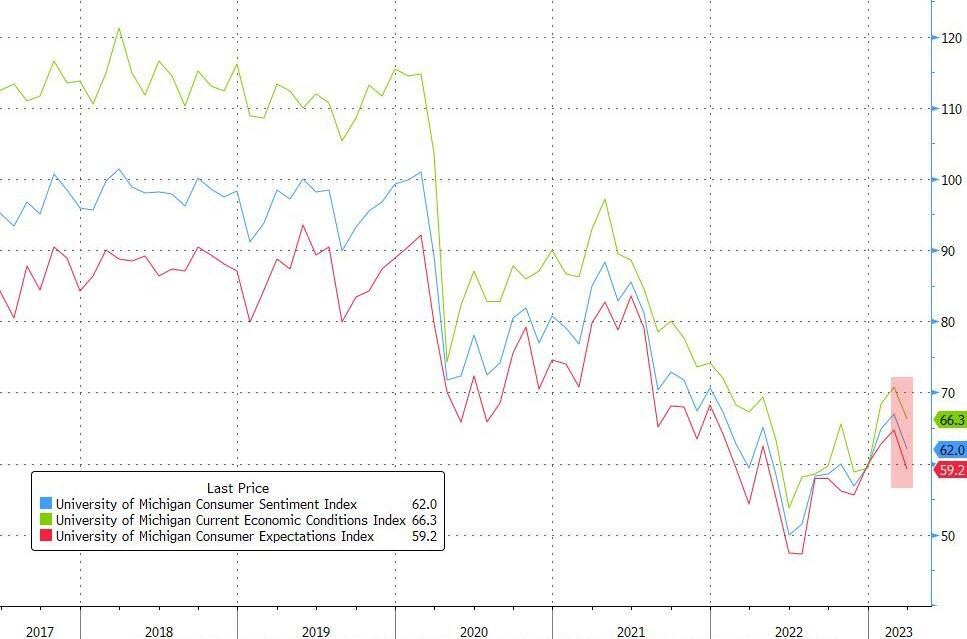
Consumer sentiment fell for the first time in four months, dropping about 8% below February but remaining 4% above a year ago.
UMich noted that "this month’s turmoil in the banking sector had limited impact on consumer sentiment, which was already exhibiting downward momentum prior to the collapse of Silicon Valley Bank. Overall, our data revealed multiple signs that consumers increasingly expect a recession ahead."
Chart That Caught Our Eye
Analyst Team Note:
Active long-only fund managers have become ever more underweight small-cap stocks over the past decade and a half. Russell 2000 stocks’ weight in multi-cap core fund holdings is just 3% today, half the 6-7% weight a decade ago. And non-Russell 3000 stocks have fallen from ~12% a decade ago to 6% today, while Russell 1000 large caps are >90% of holdings vs. ~80% then.
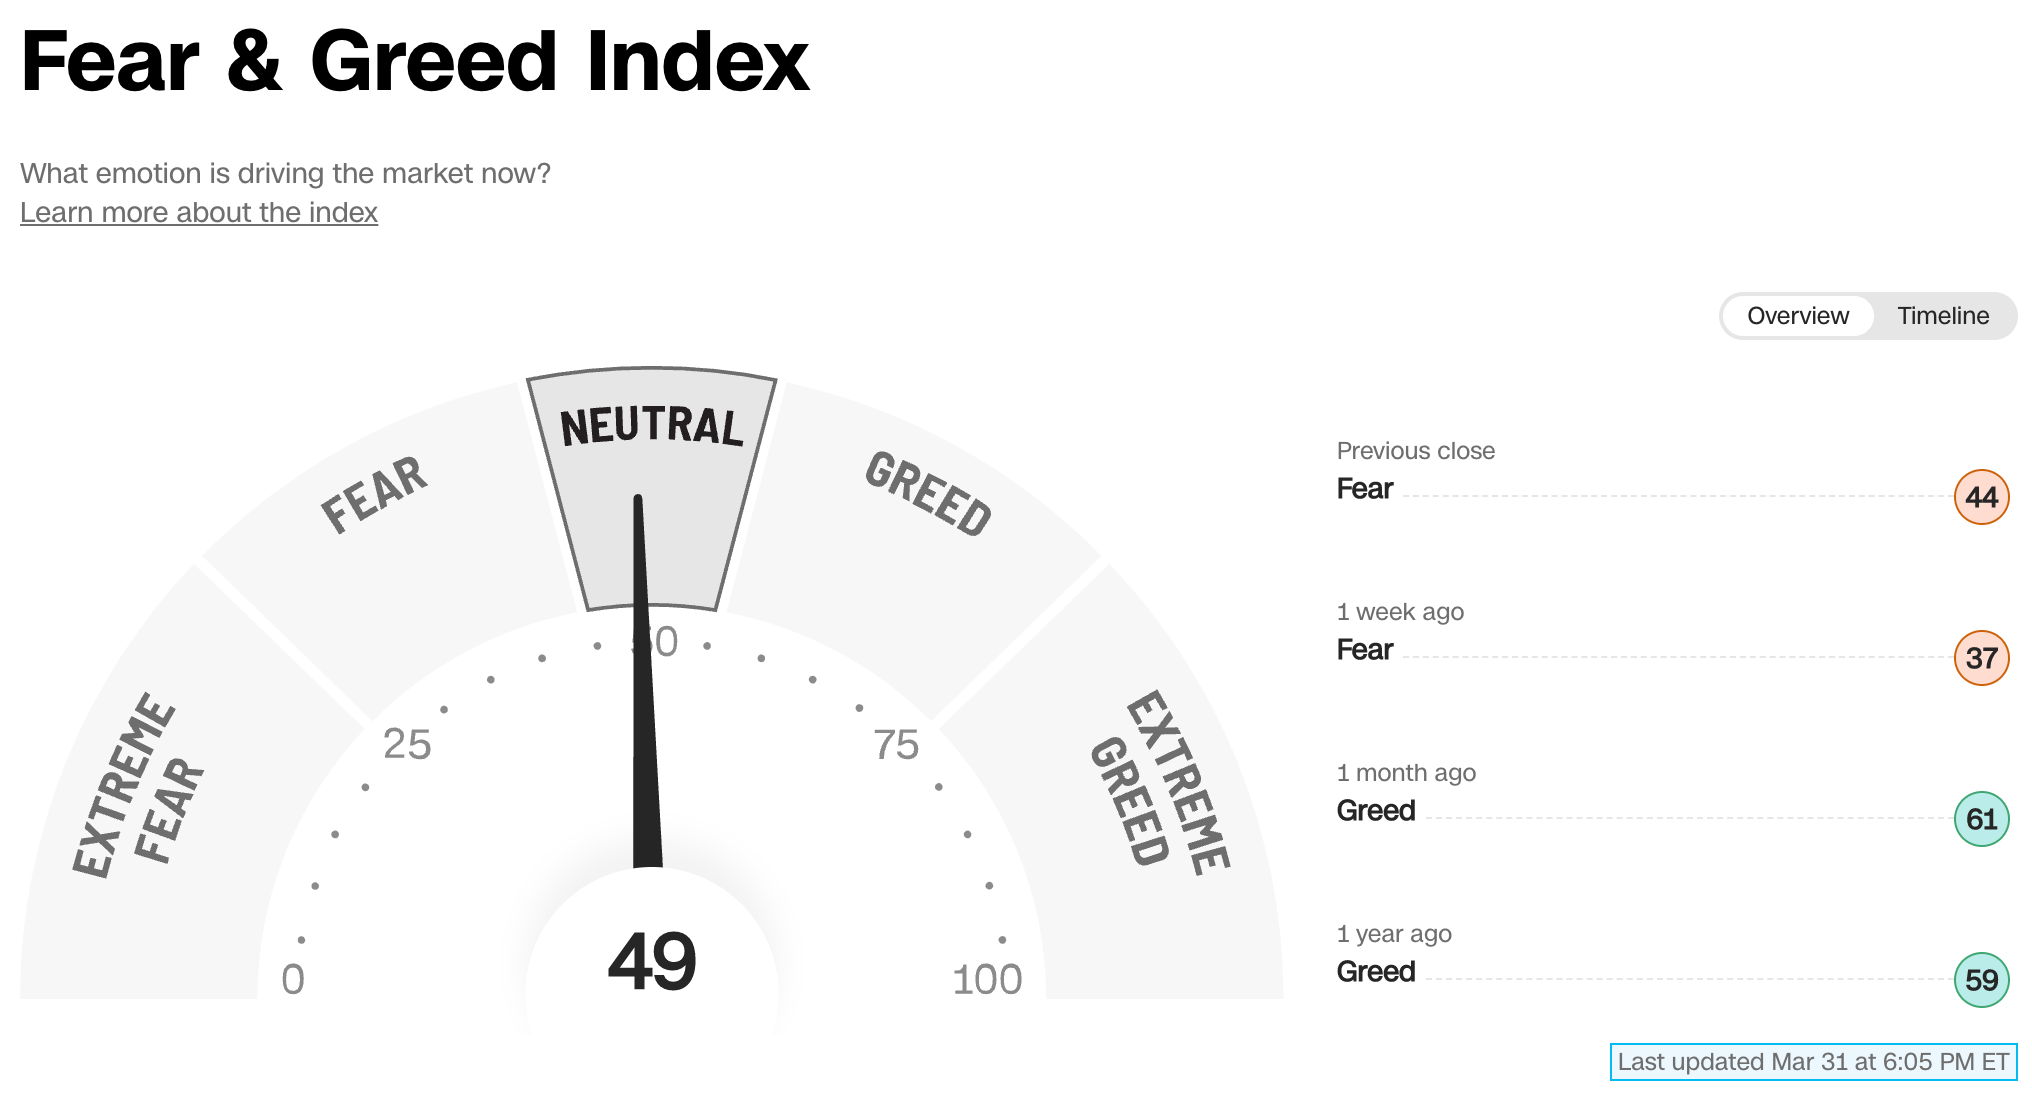
Sentiment Check
Make sure to check Larry’s most recent market updates via his personal newsletter.