3.27.23: All Signs point to larger Directional moves after consolidation is finished.
or Public Readers: Weekly Key U.S. and China brief market notes by Larry Cheung's Analyst Staff Team for our Public Email List
Note to Readers from Larry: We believe that larger directional moves are ahead for markets in the upcoming weeks as we approach the next earnings season. Key Levels on themes/sectors (financials/Semiconductors/consumers/China/and more) of interest are discussed in greater detail in our most recent strategy note below. Best to know the areas/regions where prices will likely react ahead of time -planning always beats out procrastination if you are interested in finding alpha beyond just index returns.
Strategist Larry uses Interactive Brokers as his core brokerage. Feel free to check out IB. I currently park excess cash (yielding 4%+ on idle cash) at Interactive Brokers.
In our emails, we will provide the following coverage points:
Brief Overview of U.S. & China Markets
Macro Chart in Focus
U.S. & China Upcoming Economic Calendar
Chart That Caught Our Eye
U.S and China Markets Brief Snapshot 🇺🇸 🇨🇳
(Powered by our Channel Financial Data Provider YCharts)
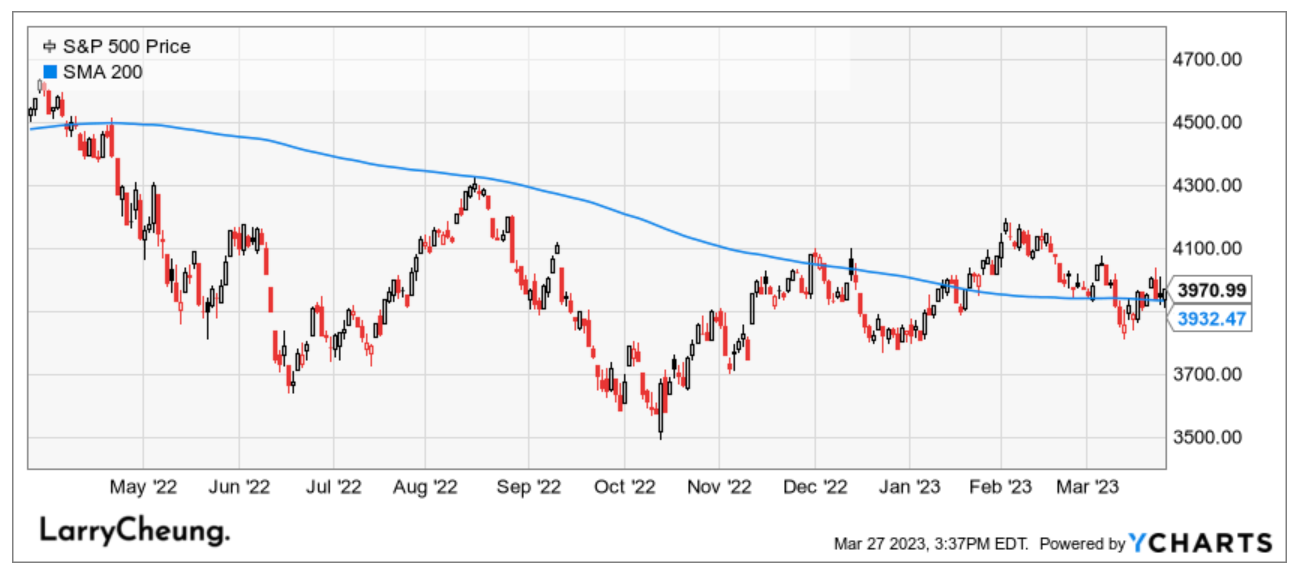
S&P 500 Index: 3970.99
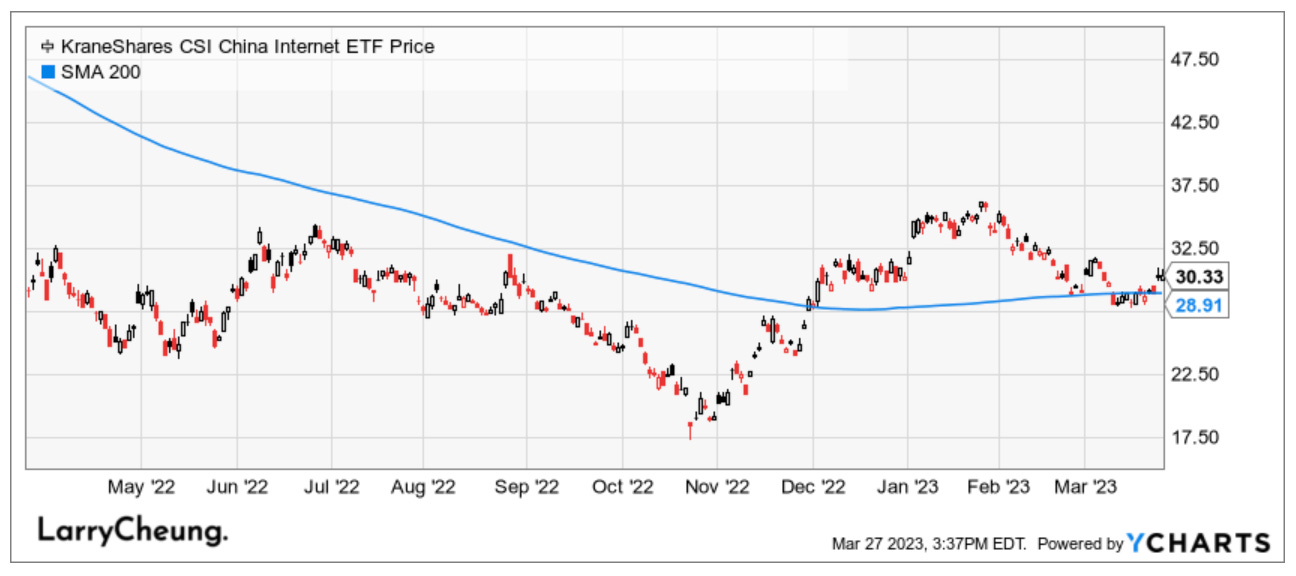
KWEB (Chinese Internet) ETF: $30.33
Analyst Team Note:
As the Nasdaq stalls near resistance and the Russell 2000 defends support, the SPX is stuck in the middle with first support at 3810-3764 and resistances near 4078 4101 (early March and December highs) and 4160-4195 (June 2022 and February highs).
The SPX closed back above its 40-week MA at 3941 after two weekly closes below it. This is a victory for the bulls, but a long tail on the weekly candle chart from the week’s high of 4039 to the week’s close of 3771 shows resilient bears, reducing bullish conviction.
The rising 200-week MA backs up this support near 3737 and is above the June, September, and October 2022 lows at 3636, 3584, and 3491, respectively.
The SPX pattern remains challenged if the index stalls and does not decisively rally beyond the zone of the 13, 26, and 40-week MAs from 3914 to 3988.
From BofA Technical Resesarch
Macro Chart In Focus
Analyst Team Note:
Credit availability was already suffering the effects of the Fed tightening cycle - one of the fastest on record - even prior to the recent turmoil, with banks tightening their lending standards sharply over the past 3 quarters.
This is likely to worsen following the banking crisis and tighter lending conditions will surely have a negative impact on the economy. If regional banks slow down lending activity due to ongoing deposit outflow issues, small businesses will feel even more pressure. Note that regional banks make up 35-40% of bank lending and supply credit mostly to small and medium businesses. Small and medium businesses generate 40% of US GDP and employ 50% of the US workforce.
Upcoming Economic Calendar
(Powered by our Channel Financial Data Provider YCharts)
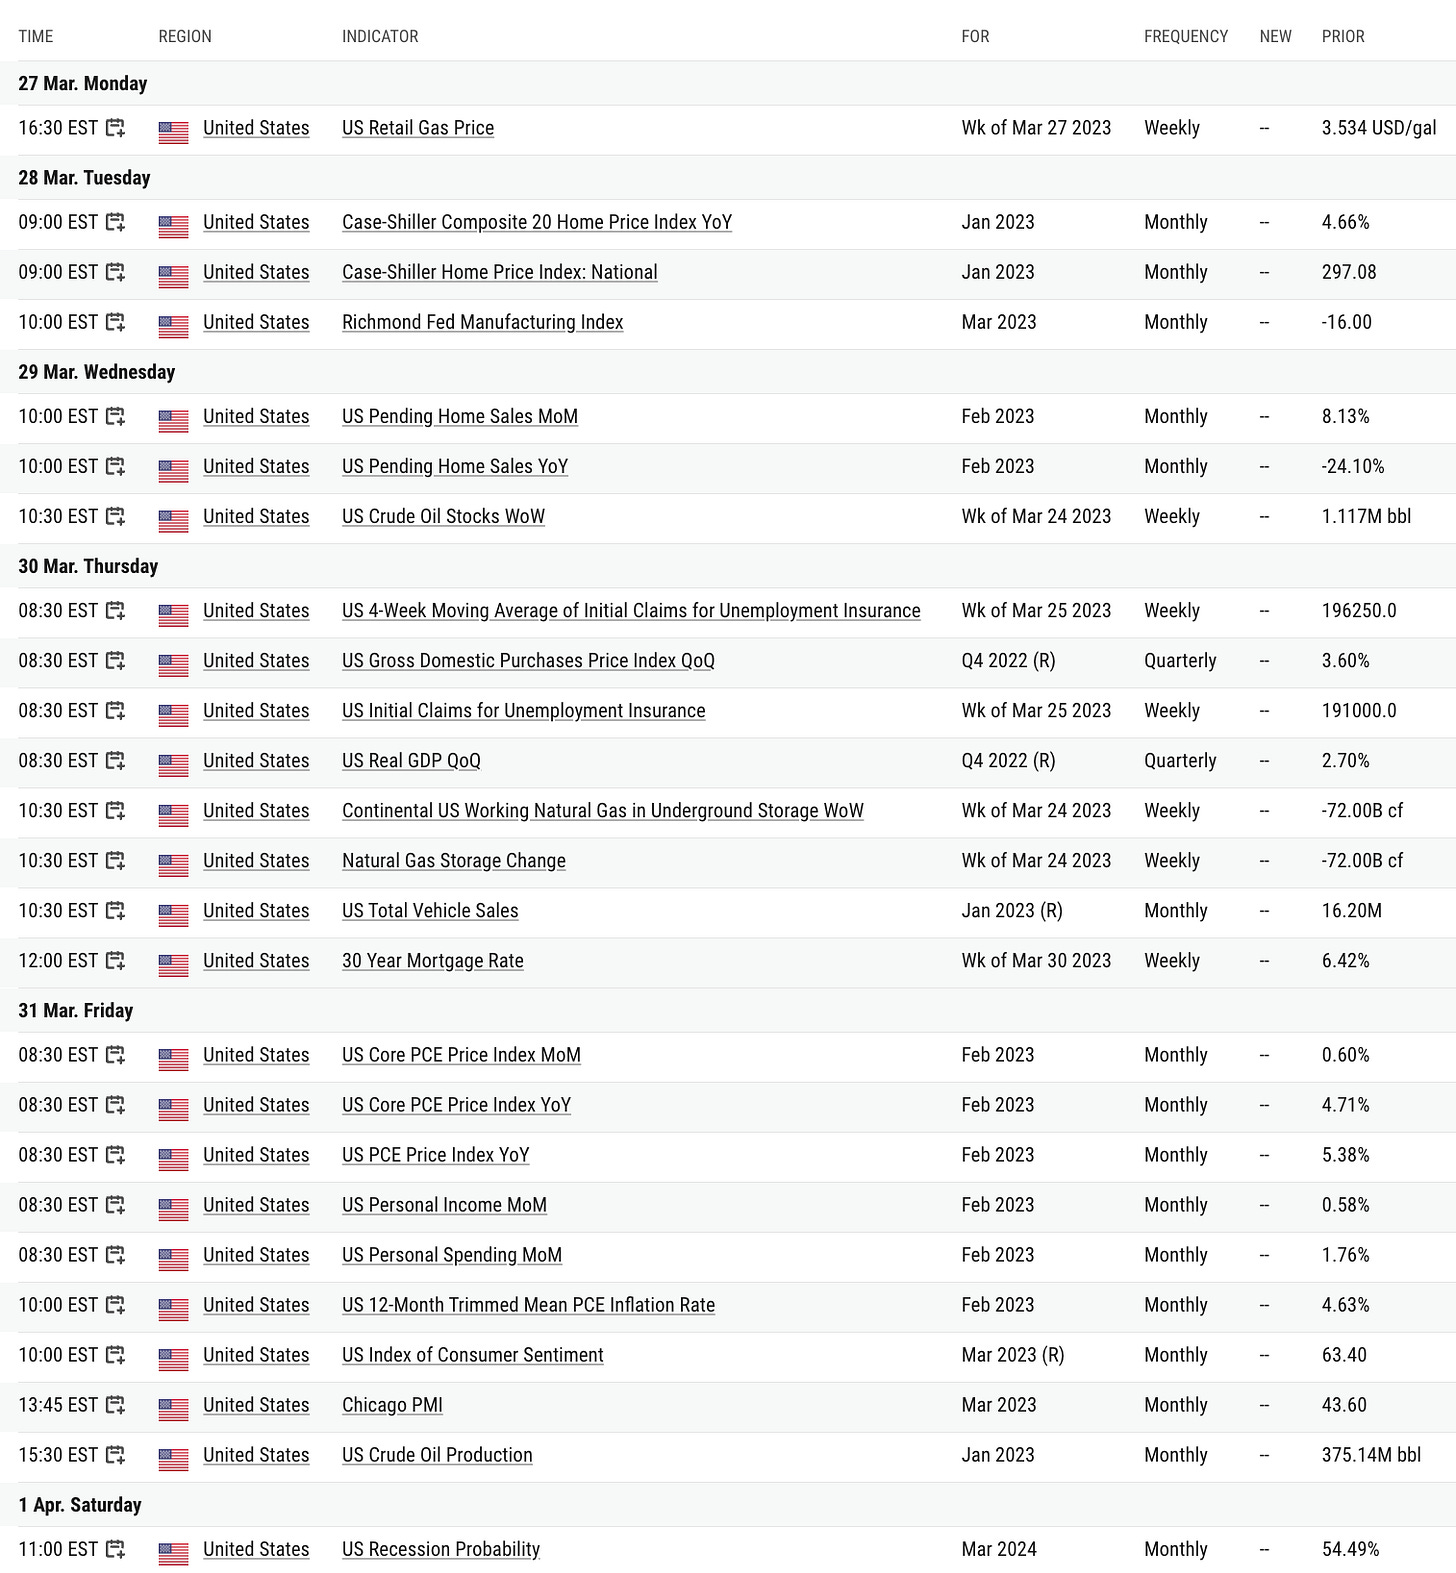
U.S Economic Calendar (Upcoming Data Points)
China Economic Calendar (Upcoming Data Points)
N/A
Analyst Team Note:
For the 11th month in a row, The Dallas Fed Manufacturing Outlook survey printed negative (signaling contraction) in March, dropping to -15.7 (from -13.5), significantly below the -10.0 expected bounce.
Chart That Caught Our Eye
Analyst Team Note:
“We estimate that one-fourth of current work tasks could be automated by AI in the US, with particularly high exposures in administrative (46%) and legal (44%) professions and low exposures in physically-intensive professions such as construction (6%) and maintenance (4%).”
“60% of workers today are employed in occupations that did not exist in 1940, implying that over 85% of employment growth over the last 80 years is explained by the technology-driven creation of new positions.”
Sourced from Goldman Sachs


