Make sure to check out Interactive Brokers above as idle cash now will yield more than 4.5% as the Fed just raised rates.
Key Investing Resource: Strategist Larry uses Interactive Brokers as his core brokerage. Feel free to check out IB. I currently park excess cash at Interactive Brokers. Check it out. It’s a great brokerage.
In our emails, we will provide the following coverage points:
“An unusual combination of divergences in the stock-market volatility space suggests the VIX is at elevated risk of pricing higher, and this may even happen with rising rather than falling equity prices. Volatility of volatility is near 10-year lows making call options on the VIX cheap.
Buying the VIX is the quintessential widow-maker trade. It is rare for the gauge to rise, with most of such instances over the last 20 years episodic and occurring when the market was falling. Most of the time, the market rises and volatility falls - there is an entire sub-industry devoted to exploiting and perpetuating this, which has swollen further in size in recent years with the boom in zero-days-to-expiry (0DTE) trading.
Not only is the VIX near its post-pandemic lows, it has also never been more out of step with cross-asset volatility – FX, fixed-income and credit (which is saying something as FX and credit vol are themselves near historic lows).” - Bloomberg
Macro Chart In Focus
Analyst Team Note:
In the first two months of 2024, profits at China's industrial companies saw a notable increase of 10.2% from the previous year, marking a continuation of positive growth since August and contributing to signs of economic recovery.
This growth was influenced by a low comparison base from the previous year and follows a pattern of double-digit growth observed in four of the last five months of 2023.
In 2023, the U.S. home flipping market saw a 29.3% decrease in flipped homes compared to the previous year, marking the largest annual drop since 2008.
According to the ATTOM year-end 2023 report, the challenges in the flipping landscape were attributed to a combination of a tight housing supply and diminishing returns, leading to a decline in both the number and proportion of flipped homes relative to total home sales.
The industry saw a decrease in profits and profit margins, with return on investment reaching the lowest level since 2007.
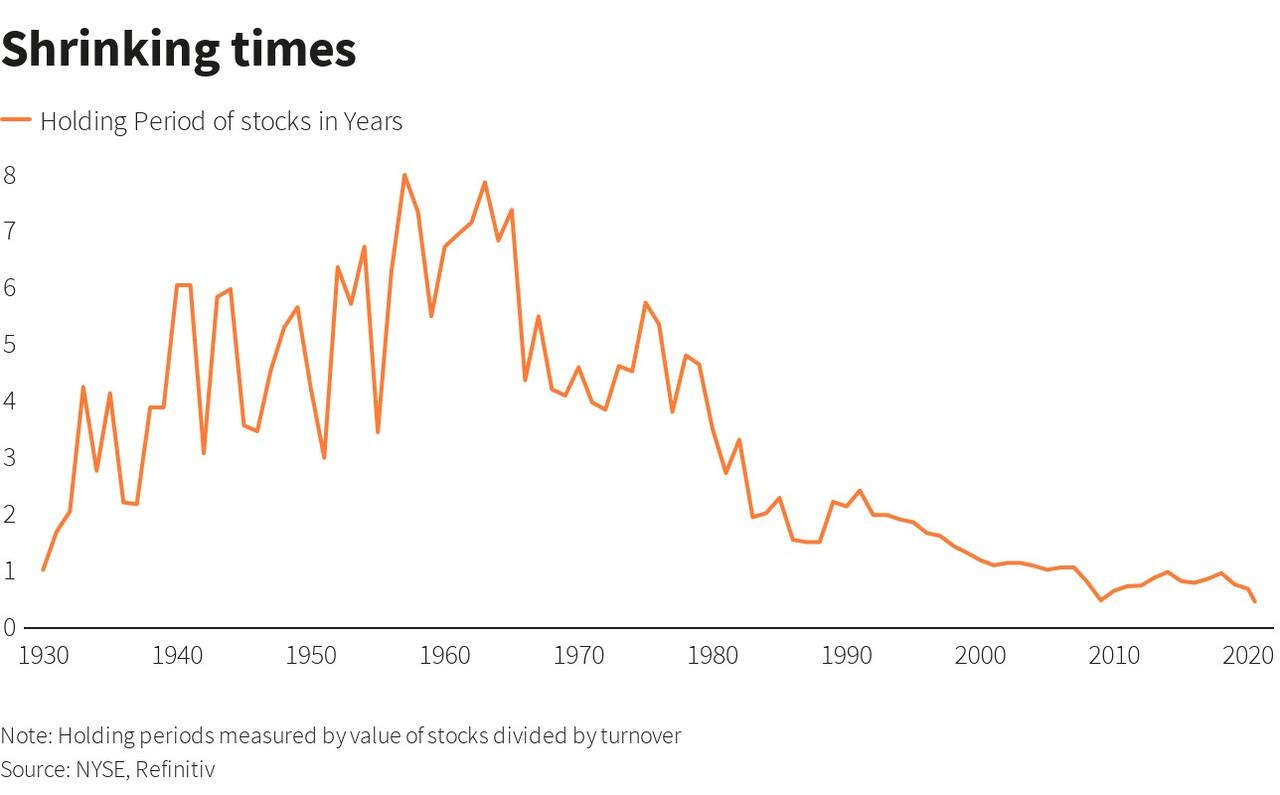
Chart That Caught Our Eye
Analyst Team Note:
True “long-term” investors are becoming incrasingly rare. Higher turnover in stocks generally indicates increased liquidity, allowing for easier buying and selling without large price impacts, which can attract more investors.
However, it may also lead to heightened volatility, especially if driven by speculative or high-frequency trading, making the market riskier for traditional investors.
Sentiment Check
Make sure to check Larry’s most recent market updates via his personal newsletter.