Note to Readers from Larry: We believe the next large move in markets in coming shortly, and the past several days of consolidation is within our expectations based on my latest strategy note. The amount of “negative” build-up is getting heavier, and the only few positive signs I see in markets at the moment is rising Gold price as well as a modestly softer Dollar Index. With precious metals & FX indicating that peak hawkishness could be near, Yields indicating that rates could stay higher for longer, and equities soft, the general message is slightly risk-off.
However, the biggest and most obvious research call to target downside in 2023 was when markets experienced euphoria in late January/early February. The easiest part of the Bearish trade has been completed.
We enter an environment where skillful (and PATIENT) stock-selection within the index will reward you. Previously mentioned themes in my strategy newsletter such as Real Estate ETF doing poorly and thrift-shop Dollar Tree doing well are playing out.
Make sure to follow me on Instagram and Twitter for public (fun & thoughtful) commentary.
3rd week of outflows: Last week, during which the S&P 500 was -2.7%, clients were net sellers of US equities (-$0.2B) for a third straight week.
Stocks > ETFs: Clients sold ETFs but bought single stocks for the first time in three weeks – a trend we observed throughout Jan/early Feb, with cumulative ETF flows negative so far YTD (which has not been true any full year in our post-GFC data history).
All major client groups were sellers: institutional and hedge fund clients sold equities for a third week and private clients were sellers after buying for two weeks.
Corporate buybacks accelerated but have been below typical seasonal trends for the last four weeks. Due to a strong start in Jan, buybacks YTD as a % of S&P 500 mkt. cap (0.044%) is tracking just below ‘22 records at this time (0.046%).
Clients continue to sell Industrials/Financials and buy Materials/Staples
Clients sold stocks in six of the 11 sectors, led by Health Care and Communication Services. Industrials and Financials have the longest recent selling streaks (last six weeks).
Tech saw the biggest inflows after leading outflows the prior week, and together with Discretionary has seen the most consistent inflows YTD.
Materials & Staples have seen the most consistent inflows (last five and four weeks, respectively)
Source: Bank of America
Macro Chart In Focus
Analyst Team Note:
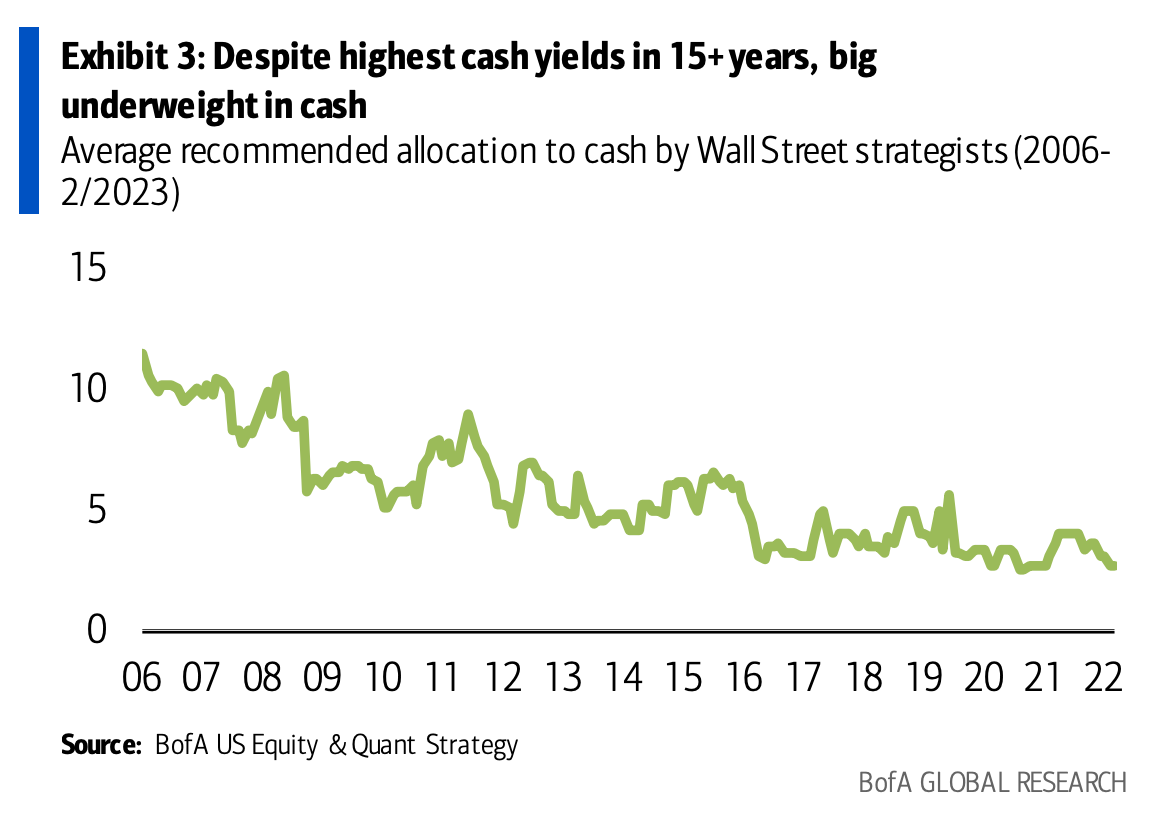
Cash allocations remain near record lows despite paying more than a traditional 60/40 portfolio. Per Bloomberg, “The yield on six-month US Treasury bills rose as high as 5.14% Tuesday, the most since 2007. That pushed it above the 5.07% yield on the classic mix of US equities and fixed-income securities for the first time since 2001, based on the weighted average earnings yield of the S&P 500 Index and the Bloomberg USAgg Index of bonds.”
As Morgan Stanley described it in a recent note, “After a 15-year period often defined by the intense cost of holding cash and not participating in markets, hawkish policy is rewarding caution.”
China’s factory activity for February rose to its highest reading since April 2012, according to data from the National Bureau of Statistics. Moody's subsequently revised its growth forecast for China's economy, upgrading it from 4% to 5% for 2023, following the release of positive factory activity data. The rating agency expects a consumption rebound to occur in the spring, driven by pent-up demand for non-traded services.
The Chinese government said that February’s reading showed continued improvement in the climate for production and business, noting that the total volume of activity “significantly increased” as well.
Chart That Caught Our Eye
Analyst Team Note:
A new study from RentCafe found that the national apartment size for studios and 1-bedroom apartments is shrinking - meaning that not only are prices on the rise across the country - but your dollar is getting you less square footage than ever.
The average size of new apartments in 2022 was 887 square feet — a 54-square-foot drop since 10 years ago. It was also the largest year-over-year decrease, down 30 square feet.
The drop in size can partially be attributed to more studios and one-bedroom apartments entering the market in 2022, reaching a historic share of 57%.