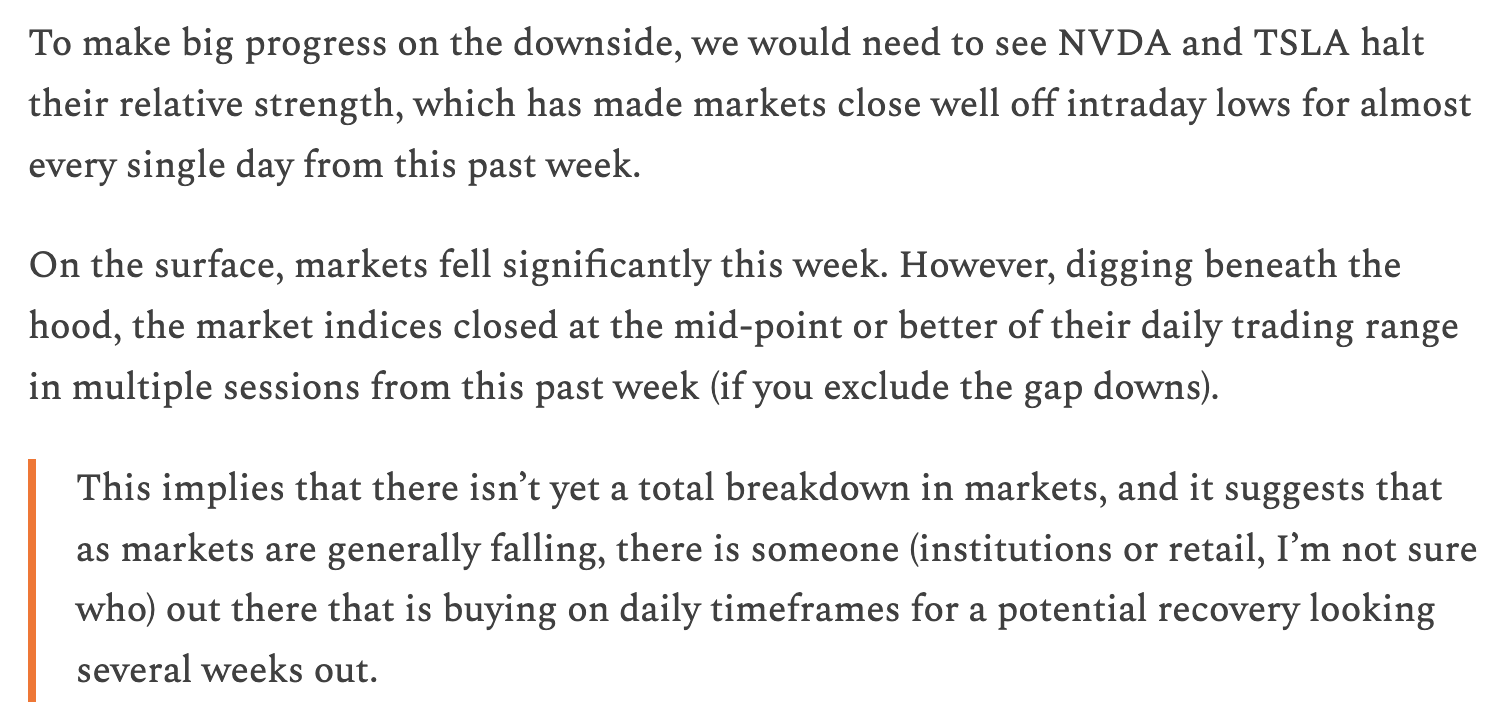
Note to Readers from Larry: In my latest March Strategy note to Members, I wrote that market action last week on the surface may have appeared weak, but there were subtle hints of buying activity in intraday timeframes which led me to believe that we may see several trading sessions marked by stability before the next leg lower.
I welcome a pause in Bearish sentiment. However, consolidation periods should not be mistaken for a definite signal that a sustainable recovery is about to happen. Tactical guidance on themes and names is provided in my latest note (see excerpt below).
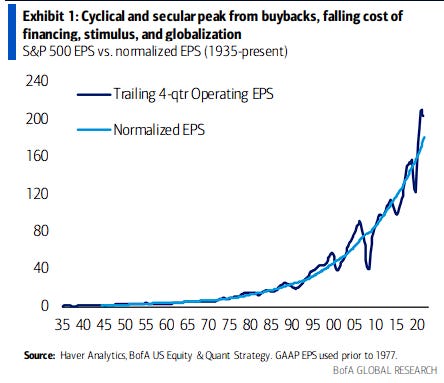
“We appear to be exiting the best era since WW2 in S&P 500 EPS. Today’s actual vs. cyclically adjusted earnings per share are close to a record gap, from low financing costs, buyback-fueled growth and peak government/Fed/corporate stimulus. Moreover, COVID’s demand pull-forward of IT capex is reminiscent of Y2K, which was followed by years of spending cuts. Consumption of goods in 2020/21 to services in 2022/23 could narrow to necessities/staples if the economy worsens. But these risks pale in comparison to secular shifts taking place.
Secular earnings growth is at a multi-decade peak. China joined the WTO in 2001, and subsequent S&P 500 margin expansion can be explained by globalization – arbitrage across COGS, labor and taxes plus frictionless global trade. Companies that have overearned are now at risk from de-globalization and a liquidity unwind. The premium that investors paid for risky stocks for the last 20 years has finally flipped to a discount: moral hazard is behind us. But investors have yet to shed their long duration growth overweight in stocks that made them money and turn to new leaders.” - BofA Equity and Quant Strategy
Macro Chart In Focus
Analyst Team Note:
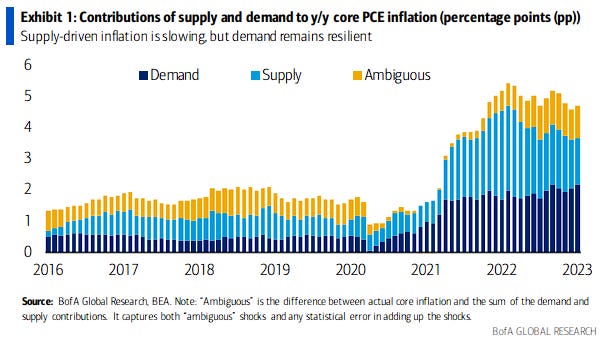
The resurgence of inflation in January is a reminder of how challenging it is for the Fed to engineer disinflation in the face of supply disruptions and resilient consumer demand. Bank of America recently found that while supply shocks peaked in early 2022 and have eased, it has not reversed. Meanwhile, demand-driven inflation has been elevated and sticky.
“The contribution of demand shocks to core inflation has continued to increase – albeit modestly – and came in at 2.2pp in January 2023. We think this is because the fiscal impulse has only faded slowly (due to large excess savings), while the labor market has improved rapidly.” - Bank of America
The main takeway. Aggregate demand needs to weaken significantly in order for inflation to return to the Fed’s target of 2%. Further supply-chain normalization and a slowdown in the labor market will help, but only to a degree.
As sad as this sounds, this means that the Fed will have to keep raising rates until it finds the point of pain for consumers, which implies that a recession is more likely than a soft landing.
January US pending home sales rose by the most since June 2020 as lower mortgage rates in the month help prop up demand. The pending home sales gauge increased 8.1%, beating the estimate of just 1%.
Per Bloomberg, the pending home sales report is often seen as a leading indicator of existing home sales given homes typically go under contract a month or two before they’re sold.
More loosening in financial conditions…
Chart That Caught Our Eye
Analyst Team Note:
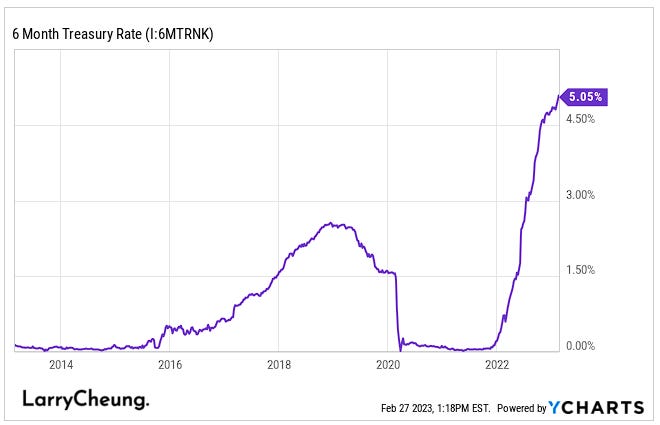
According to Bloomberg, nearly $2.5 billion flooded into the $23 billion iShares Short Treasury Bond ETF (SHV) last week, the biggest weekly inflow for SHV since March 2020.
SHV holds Treasury bonds maturing in one year or less. Six-month Treasury bills currently yield about 5%, the highest since 2007, compared to the S&P 500’s earnings yield of roughly 5.3%. That’s the smallest advantage for stocks since 2001.
Meanwhile, the average yield on US investment-grade bonds currently stands at about 5.5% — close to the smallest gap on record for the two asset classes.
I’m (Tim) personally parking some of my cash in SHV as the short-end of the curve looks more and more attractive.