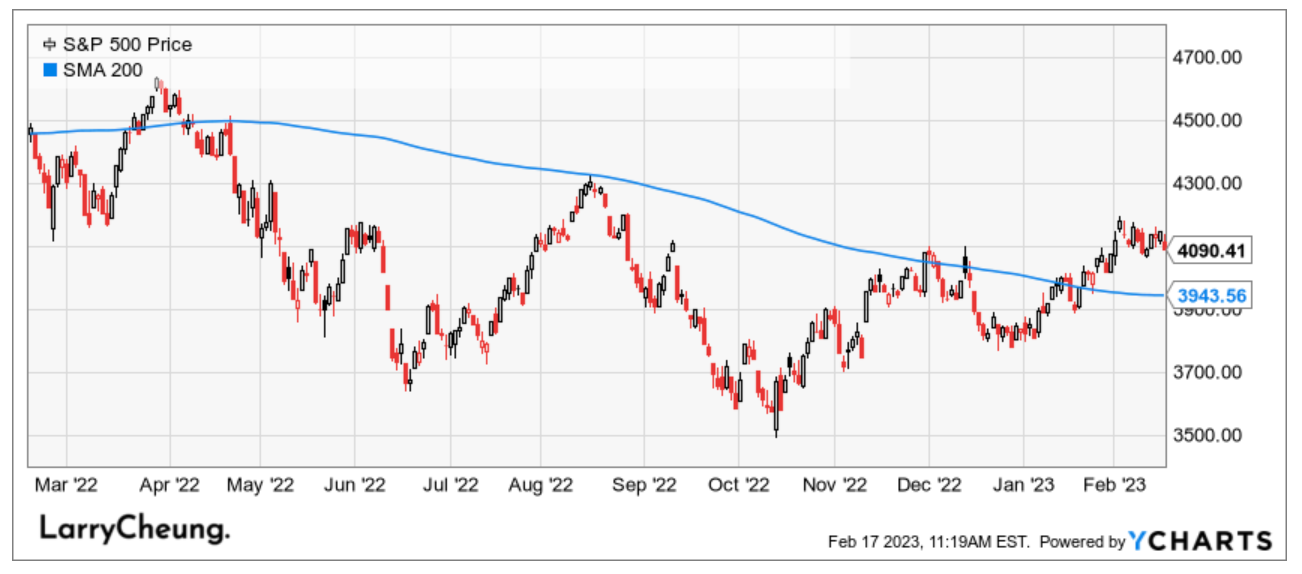
Note to Readers from Larry: As members (and the public) know, I’ve been quite bearish as the SPX approached 4200. In fact, I highlighted a list of Downside ranges (in strategy note below) on a select number of names mid-week after I had the chance to fully digest CPI.
Nearly every name on this list has now retraced about 5%+ in the span of 2 days. The reason I provide downside (and upside) ranges is for various reasons: some members find it psychologically comforting that they can lean on my levels/thinking to brace for a pullback while in a longer-term uptrend. Others like to use these levels to hedge or gauge the index’s internal structure or compare to their own expectations. I can’t really advise on how to use these levels (because that enters the realm of Financial Advice), only that I believe you will find them very helpful for your research (because my targets are calculated with a systematic methodology).
The good news for Bulls is that Bears failed to decisively close out a Friday session in which they clearly had the opportunity to. This lack of bearish pressure (esp. on Tesla) may allow Bulls to make a comeback next week.
The bad news for Bulls is that there are many unhappy souls who started positions at SPX (and related positions) at 4150+.
The market has a tendency to upset nearly every single market participant, regardless of their positioning.
It is my hope to help you find clarity in an environment where being able to dispatch signal from noise is more important than ever. Join our Community - read our research, and get ready for the weeks and months ahead with our widely read Strategy notes (at a globally accessible price point).
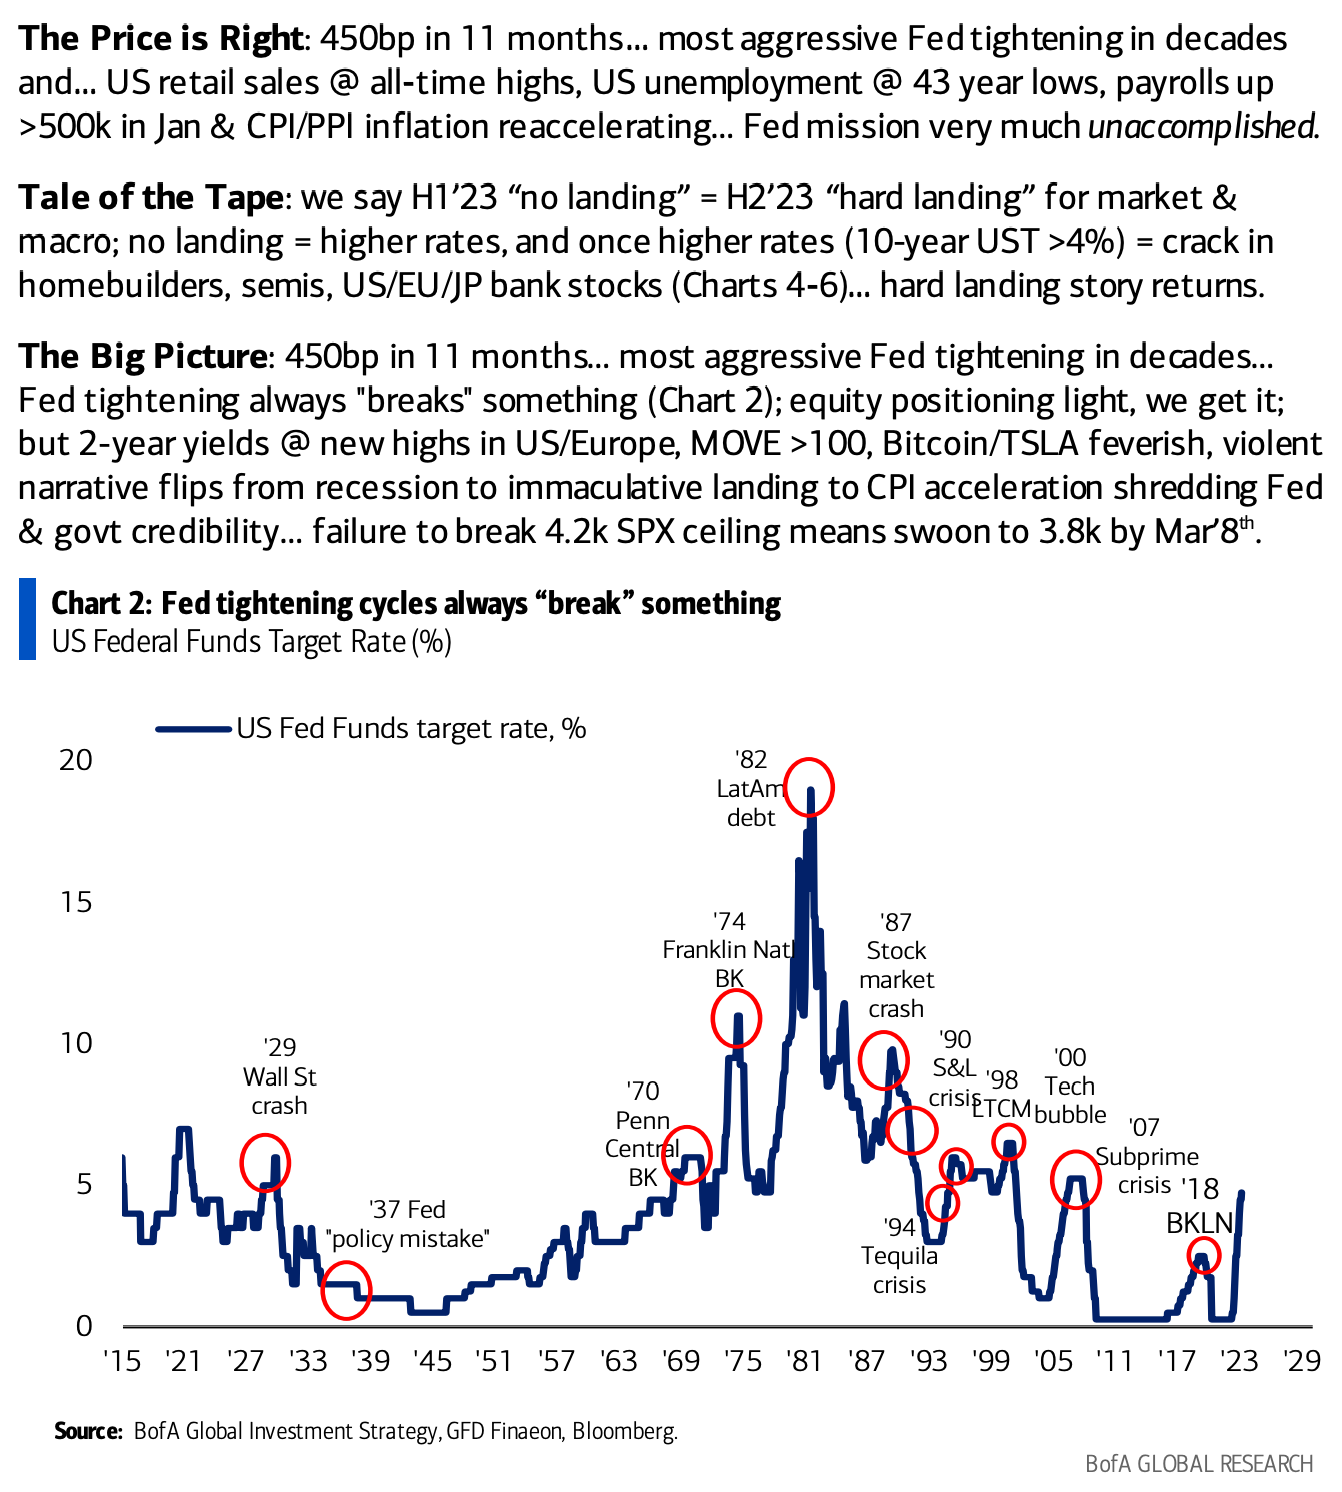
From Bank of America’s Michael Hartnett (Chief Investment Strategist)…
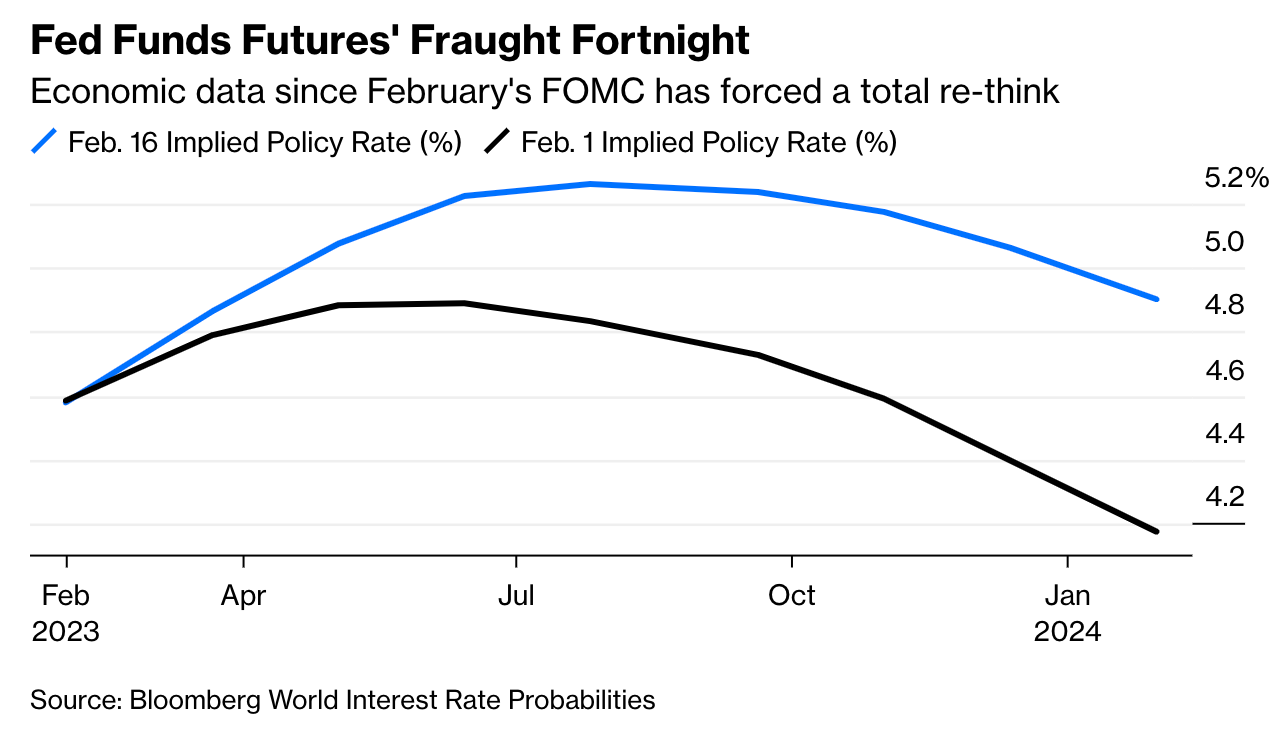
Macro Chart In Focus
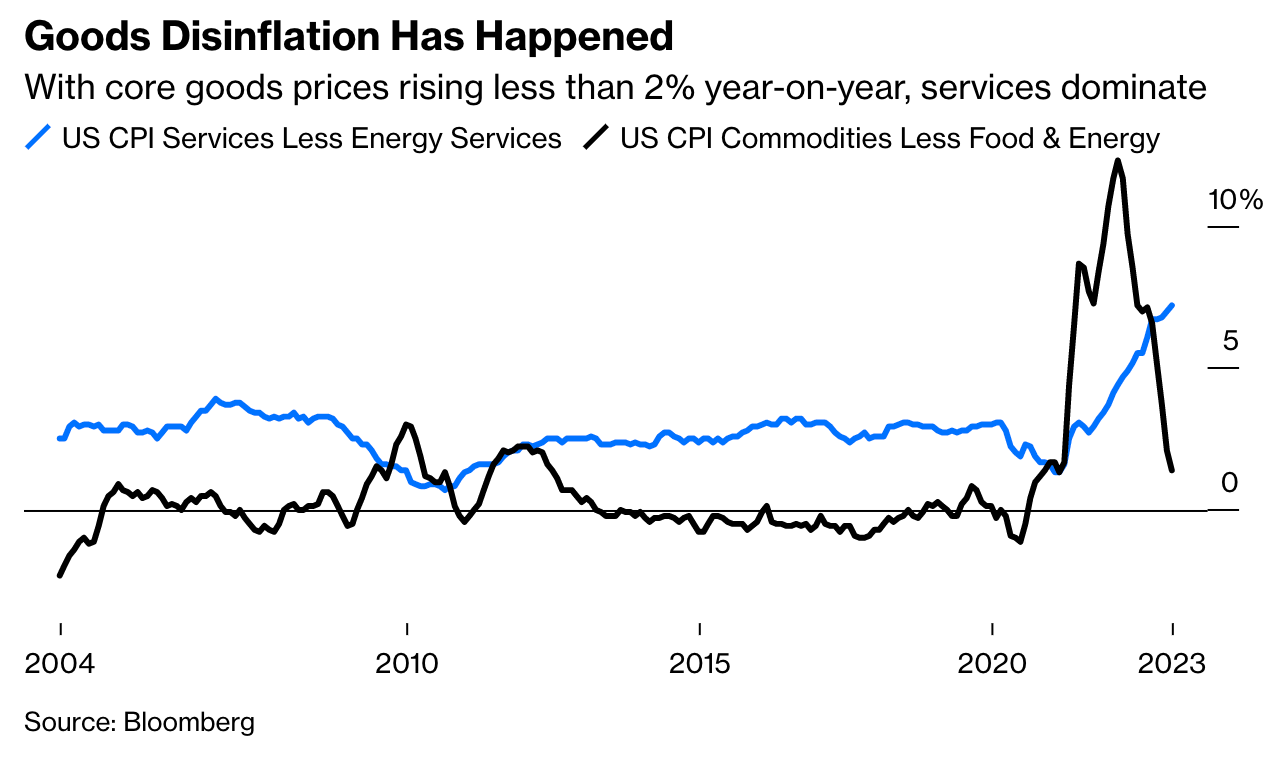
Analyst Team Note:
Let’s break down inflation. If we strip out food and energy, goods inflation surged and then plummeted to below the Fed’s inflation target of 2%. However, services inflation keeps rising. Goods inflation was indeed transitory, but that’s no longer what matters. So what will help bring it down?
With the focus on services inflation, Carl Riccadonna, chief US economist at BNP Paribas, suggests that the labor market grows in importance. The cost of services is far more skewed toward labor costs. The chart below strongly suggests that the Fed will only win the battle with services inflation when it succeeds in bringing wage settlements down, because inflation in services,excluding shelter, tends to correlate very strongly with percentage wage increases.
So now we know that a soft labor market → lower services inflation. So how’s the labor market doing? The chart below tells the story.
Cleveland Fed President Loretta Mester and St. Louis Fed chief James Bullard, two of the Federal Reserve's most hawkish policymakers, expressed their support for more significant interest rate hikes in the future and suggested that a 50 basis-point interest rate hike would have been appropriate at the central bank's recent meeting. They also stated that policymakers must remain open to larger rate hikes if economic conditions warrant them. Bullard added that he believes the fight against inflation will be a long battle and that he would like to see the Fed's policy rate reach 5.375% as soon as possible and would not rule out supporting a half-percentage-point interest rate hike at the Fed's upcoming March meeting.
The recent reacceleration of wholesale used vehicle prices is the latest evidence that the path to the Federal Reserve's official inflation rate target of 2% won't be smooth. Cox Automotive reported that its Manheim Used Vehicle Value Index, which tracks the auction prices of wholesale used cars, increased again by 4.1% from January in the first 15 days of February, marking the largest February increase since 2009.
Chart That Caught Our Eye
Analyst Team Note:
This chart shows the spread of the six-month Treasury bill yield (almost at 5% now) over the dividend yield on the S&P 500. Judged crudely by the hard cash they pay each year, the advantage is more firmly with T-bills than at any time since the early days of the Global Financial Crisis in 2007. This century, whenever the spread got this high, it was followed soon after by an epic stock market crash.
The disadvantage of investing in cash is the risk that rates will fall. Buy a six-month bill and you may have to roll it over into a lower-yielding note half a year from now. With sentiment shifting back toward rates that are higher for longer, however, that should be less of a deterrent now. So, on the face of it, cash should be offering stiff competition for the stock market.
The logic for longer bonds is different, however. Buy a 10-year bond and then watch yields rise, and you cannot exit within the decade-long term without taking a capital loss. The view that the economy is overheating and taking rates with it has, therefore, contributed to yet another leg higher for equities compared to bonds. This, again, wasn’t supposed to happen. Since October, yields had been falling, and the most popular exchange-traded fund tracking bonds with maturities of more than 20 years (universally referred to by its ticker symbol TLT) had begun to beat its counterpart ETF tracking the S&P 500 (ticker SPY).
Yet again, the trend for stocks’ outperformance, in place since the late months of 2020, remains.
If you want to bet that the startling data of the last two weeks has been a blip, this looks like a good entry point to buy some long-dated Treasuries. Meanwhile, the case appears strong for some cash to cover against the possibility of overheating, followed by a crash.