Note to Readers: Our analyst team emails will be sent out 1x per week, usually on the weekends.
As discussed in our January report, we were looking for a stable start to the year as we titled the report “looking for a reasonably stable start to the Month, followed by looming danger”. So far that is what we have gotten. However we believe the latest December jobs number is far from being a signal that the market has put in a definitive bottom. Markets rarely bottom on a jobs report, and we make no change to our stance. Markets may likely remain firm for a bit longer, but short-term relief rallies has nothing to do with the longer term macro trend that is seriously going to challenge consumer spending and confidence later this year.
Join our community - protect your capital in this environment. Take the upcoming dangers seriously.
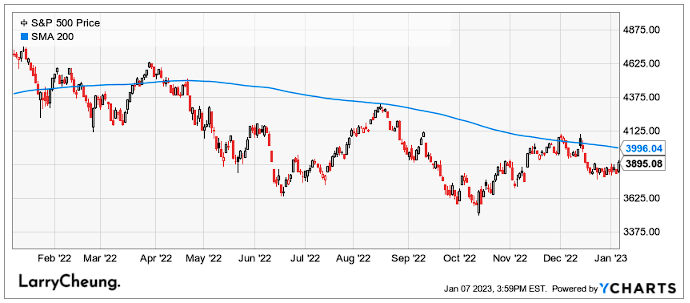
After rallies on the S&P 500 (SPX) of 8.0% and 5.4% in October and November, respectively, the SPX dropped 5.9% in December. The SPX did not decisively break above its key resistances at the declining 40-week MA (3965), year-long downtrend line (4020) and the August high (4325).
The zone of the 13-week MA to December lower high from 3874 to 4101 provide an overhang within the cyclical bear market from January 2022 with supports near the 200-week MA at 3674 and the June and October lows at 3636 and 3491, respectively.
Two charts we find interesting: Tech relative to the S&P 500 and Consumer discretionaries relative to the S&P 500.
Both are at consequential points.
After a tactical bounce took Tech above its declining relative MAs vs SPX in early August, the sector has lagged and is at risk for a 2020 into 2022 head and shoulders top vs the SPX. A rally in a strong downtrend for Discretionary stalled near big resistance. The risk for Discretionary vs the SPX is lower.
The SPX is now treading water in the 3800-3830 region (upper end of demand zone) for several days. This region personally is not attractive to me on the long side, and I’m a seller upon any large move back up to the macro downtrend line.
In terms of where longs become interesting to me, I think a bounce could come in the ~3600-3700 region.
Similar to 2021, there was a continued, sharp rotation into Value and away from Growth, especially in the first half of 2022 — supported by a move higher in rates. However, the rotation saw a bit of a reversal after peaking in May as expectations of slowing economic growth alongside higher rates have created a less compelling environment for outsized Value out performance over Growth.
Value vs Growth has reversed all of its underperformance over the past 5-years. While Value correlation with 10Y yields remains positive, it has moderated somewhat vs. the start of the Fed hiking cycle. Growth on the other hand remains more negatively correlated with 10-year UST yields than at any point in the past. Also, despite the moderation in the Value vs Growth trade in 2H 2022, the two factors remain quite negatively correlated.
Correlation across various macro variables suggests that Value has been even more correlated with the USD than it has been with Rates; while Growth has been most positively correlated with the overall market direction (S&P 500) and most negatively with the USD - both at extreme levels vs. the last 5 years.
This past week, the Fed released their minutes from the December FOMC meeting. Here were the brief highlights. To read our full analysis, click the link below.
Fed not pleased with investors… “Participants noted that, because monetary policy worked importantly through financial markets, an unwarranted easing in financial conditions, especially if driven by a misperception by the public of the Committee's reaction function, would complicate the Committee's effort to restore price stability."
Inflation Risks skewed to upside… “With inflation still elevated, the staff continued to view the risks to the inflation projection as skewed to the upside.”
Financial stability will be monitored… “Staff indicated that they would continue to monitor money market conditions closely as balance sheet reduction proceeds."
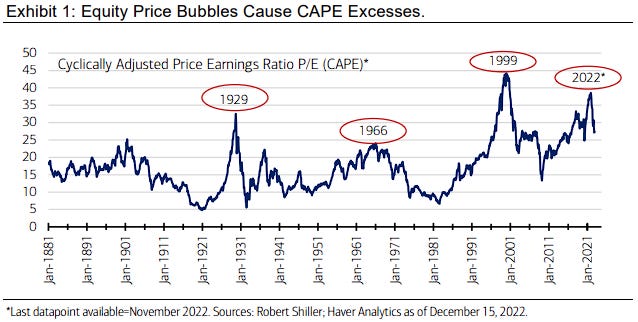
The CAPE ratio is a long-term indicator of stock valuation that smooths out fluctuations in a company's earnings over the business cycle. It has a strong relationship with 10-year forward returns, with low CAPE levels typically preceding periods of high returns, and high CAPE levels often being followed by subpar returns. Extremely high CAPE ratios are sometimes associated with asset price bubbles, when irrational investors drive prices beyond fundamental levels.
These bubbles have historically been followed by long periods of time before stocks surpass their prior peak as earnings take a long time to catch up to the inflated prices.
Source: Merrill Lynch CIO
Sentiment Check
We want to take a moment to thank Interactive Brokers for being one of our Channel’s trusted Partners and to inform my audience of the special features they have given that our online friends here closely follow Chinese Internet stocks (BABA/Tencent).
Much of Larry’s audience is concerned about the US ADR issue of Chinese Stocks being delisted.