Make sure to check out Interactive Brokers above as idle cash now will yield more than 4.5% as the Fed just raised rates.
Key Investing Resource: Strategist Larry uses Interactive Brokers as his core brokerage. Feel free to check out IB. I currently park excess cash at Interactive Brokers. Check it out. It’s a great brokerage.
In our emails, we will provide the following coverage points:
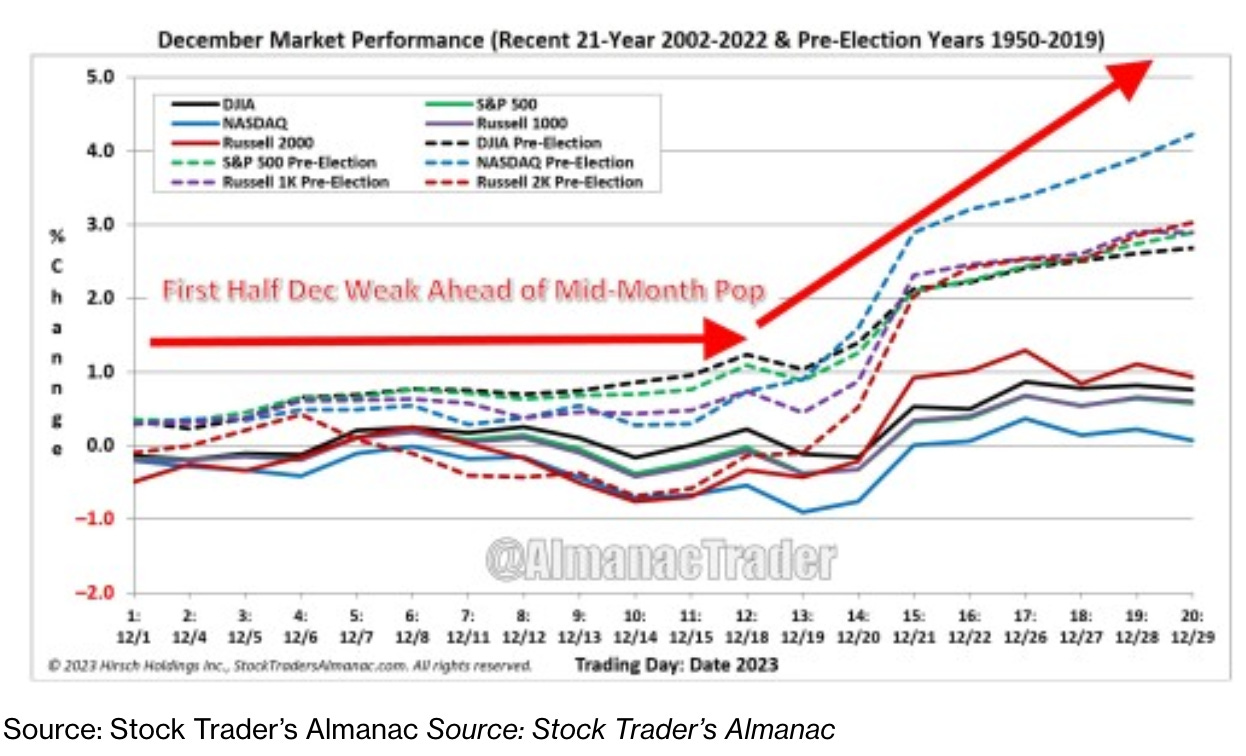
Historically, December has been a favorable month for the S&P 500, ranking as the third-best month with an average gain of 1.4% since 1950, according to The Stock Trader’s Almanac.
This trend is partly attributed to portfolio managers' practice of "window dressing," where they buy high-performing stocks towards the year's end to enhance their fund's appearance.
Additionally, stocks often experience a strong performance during the period covering the last five sessions of December and the beginning of the new year, contributing to this seasonal trend.
Macro Chart In Focus
Analyst Team Note:
The bond market is experiencing a rally, fueled by expectations that the Federal Reserve's cycle of rate increases is ending, with traders speculating on potential rate cuts as early as March.
Despite a recent rise in Treasury yields, the market anticipates at least 1.25 percentage points of easing next year.
This sentiment is influenced by the possibility of a soft economic landing or a more severe downturn, and is reinforced by data indicating cooling inflation and a potentially mild recession.
Federal Reserve officials, including Chair Jerome Powell, have cautioned against premature speculation on policy easing, with conflicting data and the upcoming US employment report expected to further test the market's resilience.
The pullback in Millennial home buying is also shown in the share of first-time home buyers among all buyers, which was just 28% in October 2023, down from the peak of 35% in mid-2020 when mortgage rates were at historic lows.
On the flip side, the share of all home sales that had no financing (i.e., all-cash sales), which likely skews toward wealthier older generations, surged to 28% in October 2023, up from the low of 16% in 2020.
Chart That Caught Our Eye
Analyst Team Note:
Recent research from Columbia Business School and the European Central Bank found that during market crises, such as COVID-19 in 2020, mutual funds, rather than individual or corporate investors, are the most likely to engage in frantic selling ("runs").
The study found that mutual funds with substantial cross-ownership in other funds experienced significantly higher outflows, especially in bond funds.
This contradicts the common belief that retail investors or corporations in need of liquidity are the main drivers of such sell-offs.
The findings highlight the amplifying effect of mutual funds selling other fund shares in times of stress, suggesting that investments heavily owned by funds may face greater risks during market downturns.
Sentiment Check
Make sure to check Larry’s most recent market updates via his personal newsletter.