Make sure to check out Interactive Brokers above as idle cash now will yield more than 4.5% as the Fed just raised rates.
Key Investing Resource: Strategist Larry uses Interactive Brokers as his core brokerage. Feel free to check out IB. I currently park excess cash at Interactive Brokers. Check it out. It’s a great brokerage.
In our emails, we will provide the following coverage points:
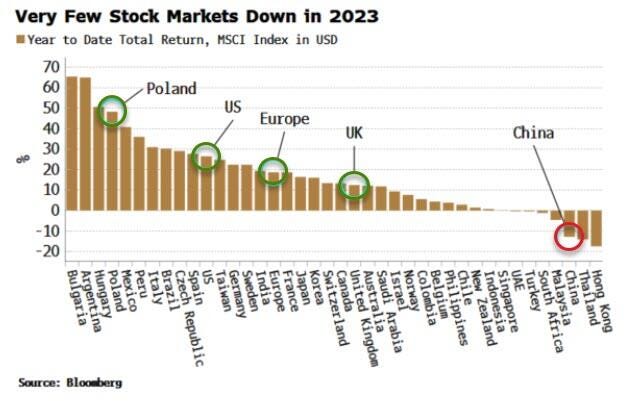
In 2023, despite high interest rates worldwide, most global stock and bond indexes have seen gains, defying expectations.
Historically, top performers in one year often underperform the next, suggesting that 2024 might see a reversal, potentially benefiting Chinese stocks and bonds while Eastern European assets might lag.
Macro Chart In Focus
Analyst Team Note:
In 2023, the "Magnificent 7" stocks—Apple, Microsoft, Google, Tesla, Nvidia, Amazon, and Meta—have become a focal point of bandwagon bias in investment, with their collective stock prices surging 71%, significantly outperforming the modest 6% gain of the remaining 493 stocks in the S&P 500.
This disparity has elevated their combined contribution to nearly 30% of the S&P 500's value, leading to heightened valuations.
Despite these companies being fundamentally stronger than the S&P 500 average, with expected revenue growth of 8% more and forecasted net margins of around 21% (double that of the S&P 500), there's skepticism about whether such high valuations can be sustained or repeated in 2024, particularly if the price growth has outstripped fundamental performance.
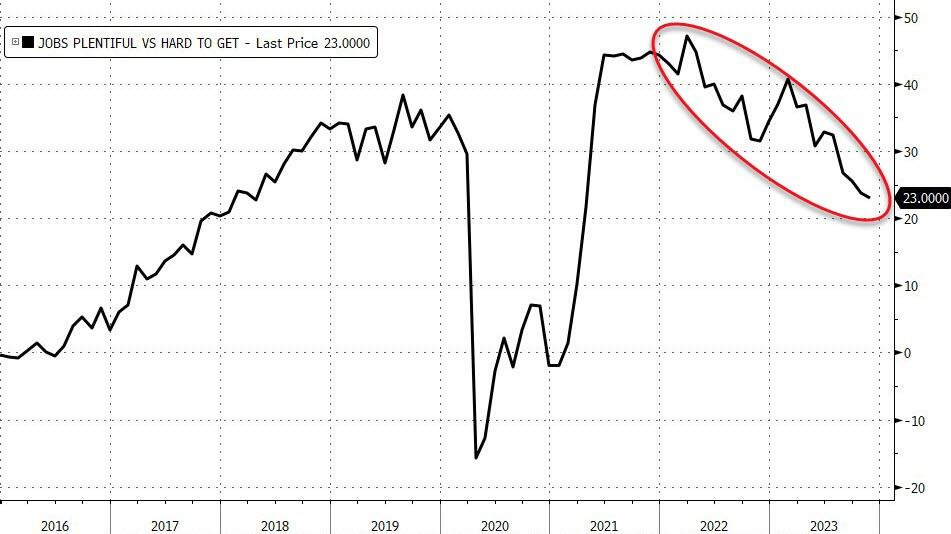
The labor market indicators are trending worse - now at the weakest since April 2021...
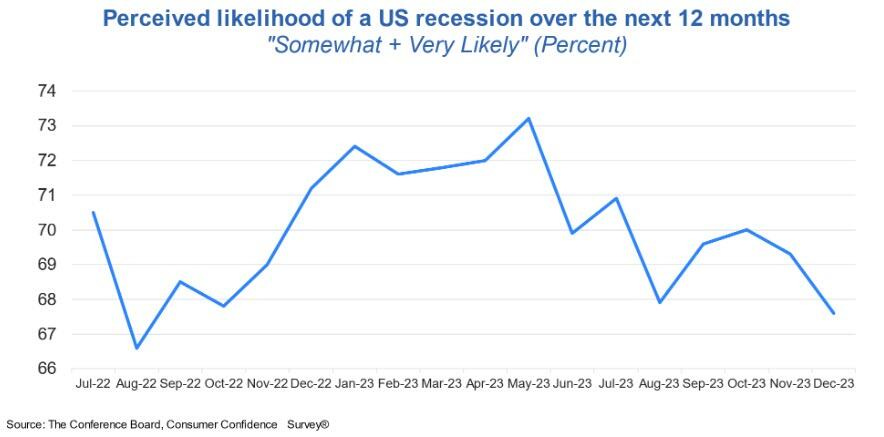
Despite this, the consumers’ perceived likelihood of a US recession over the next 12 months fell in December to the lowest level seen this year...
Chart That Caught Our Eye
Analyst Team Note:
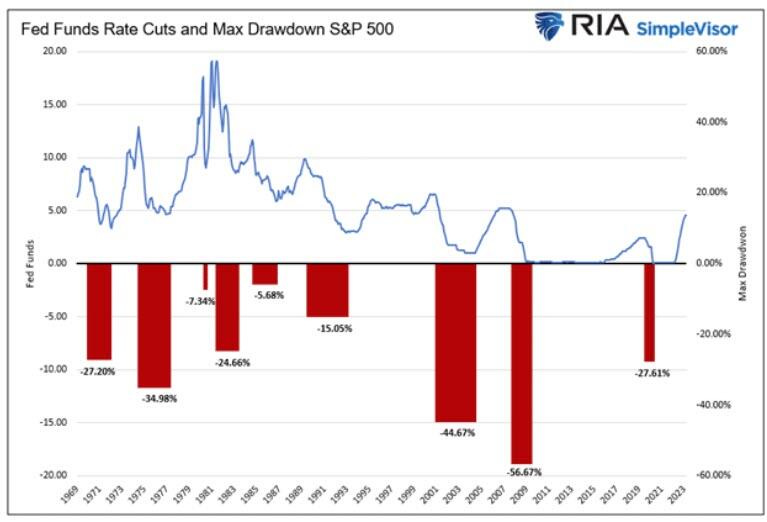
Since 1970, there have been nine instances in which the Fed significantly cut the Fed Funds rate. The average maximum drawdown from the start of each rate reduction period to the market trough was 27.25%.
The three most recent episodes saw larger-than-average drawdowns. Of the six other experiences, only one, 1974-1977, saw a drawdown worse than the average.
Sentiment Check
Make sure to check Larry’s most recent market updates via his personal newsletter.