Make sure to check out Interactive Brokers above as idle cash now will yield more than 4.5% as the Fed just raised rates.
Key Investing Resource: Strategist Larry uses Interactive Brokers as his core brokerage. Feel free to check out IB. I currently park excess cash at Interactive Brokers. Check it out. It’s a great brokerage.
In our emails, we will provide the following coverage points:
The historical performance of the S&P 500 (SPX) indicates a bullish trend continuation pattern when a weekly close occurs above the 40-week MA while both the 40-week and 200-week MAs are trending upwards, especially after the index has dipped below the 40-week MA.
This pattern has been identified at several points in the past decade: June and November 2012, November 2016, June 2019, June 2020, and March 2023.
Following these signals, the SPX has experienced significant rallies, with returns following the pattern ranging from 11% in June 2012, to as high as 56% after the June 2020 signal. The rallies after November 2012, November 2016, and June 2020 were particularly strong, lasting multiple years and yielding returns of 51%, 36%, and 56%, respectively.
Macro Chart In Focus
Analyst Team Note:
Since peaking at 5.02% on October 23, yields on 10-year U.S. Treasuries have decreased significantly as bond market traders anticipate an end to rate hikes.
This shift is attributed to a mix of factors: the U.S. has less need to refinance its debt (benign refunding needs), employment data has been weaker than expected, and there are indications that the Federal Reserve might adopt a less aggressive (less hawkish) stance.
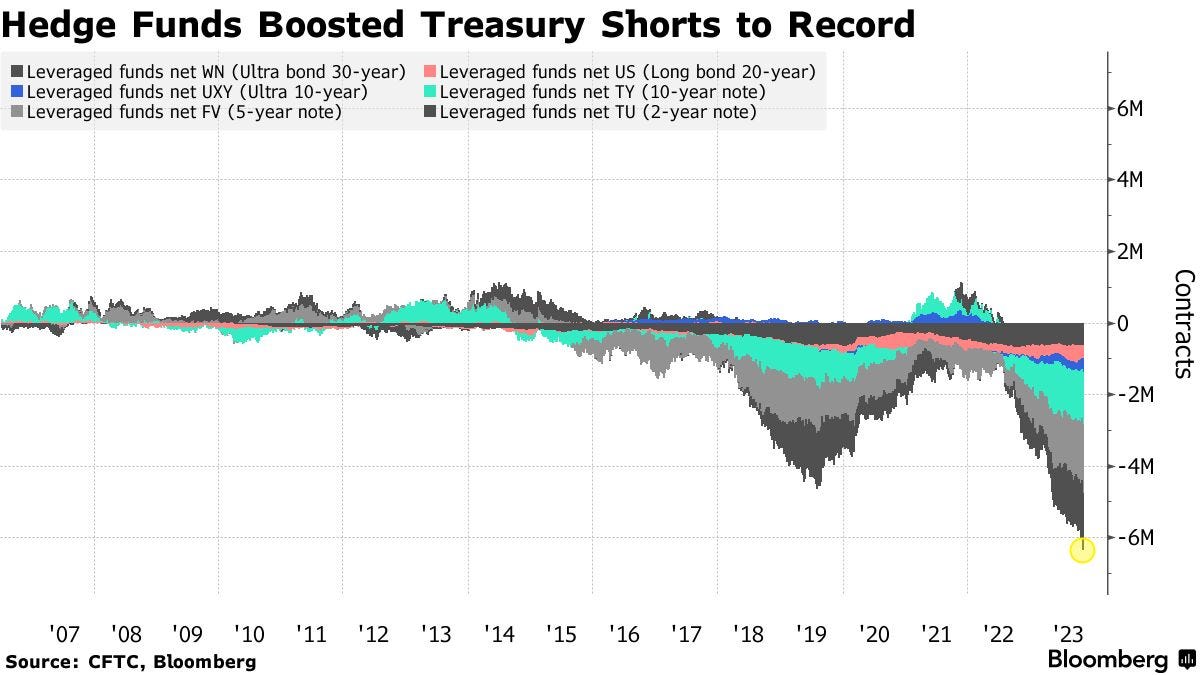
Leveraged funds have increased their net short positions on Treasury futures to record levels since 2006 by the end of October, as reported by the Commodity Futures Trading Commission.
American wheat exports have plummeted to their lowest levels in 20 years due to a combination of a severe drought affecting the Mississippi River and increasing competition from abundant global grain supplies.
The Mississippi River, which is a vital waterway for transporting about two-thirds of U.S. grain exports, has seen significantly reduced water levels, impacting the ability to ship grain efficiently.
Although water levels have risen slightly from historic lows, global buyers have turned to other sources, diminishing demand for U.S. grain and affecting the country's standing as a preferred exporter.
Chart That Caught Our Eye
Sentiment Check
Make sure to check Larry’s most recent market updates via his personal newsletter.