Make sure to check out Interactive Brokers above as idle cash now will yield more than 4.5% as the Fed just raised rates.
Note from Tim Chang: Global stock funds attracted $23.5 billion in the week through Nov. 15, the second-biggest inflows of the year…
Key Investing Resource: Strategist Larry uses Interactive Brokers as his core brokerage. Feel free to check out IB. I currently park excess cash at Interactive Brokers. Check it out. It’s a great brokerage.
In our emails, we will provide the following coverage points:
Over the last 10 days, CTAs have bought nearly $70B of US equities (and have now flipped from short to long). According to Goldman, this is the largest 10-day buying on record.
Macro Chart In Focus
Analyst Team Note:
In 2023, the U.S. economy unexpectedly avoided a recession and progressed towards a 'soft landing', contradicting earlier fears.
A key factor was the stronger-than-anticipated GDP growth, which occurred despite the reduction of monetary and fiscal policy support.
Initially, concerns about inflation led to expectations of aggressive Federal Reserve actions, but these were mitigated by banking stress in spring and the realization by summer that strong GDP growth did not hinder the rebalancing of the labor market or the reduction in wage growth and inflation.
This unexpected outcome was partly due to the supply side's performance, including a recovery in labor supply, fading transitory impacts on wages and prices, and responses to high prices like increased rental housing construction.
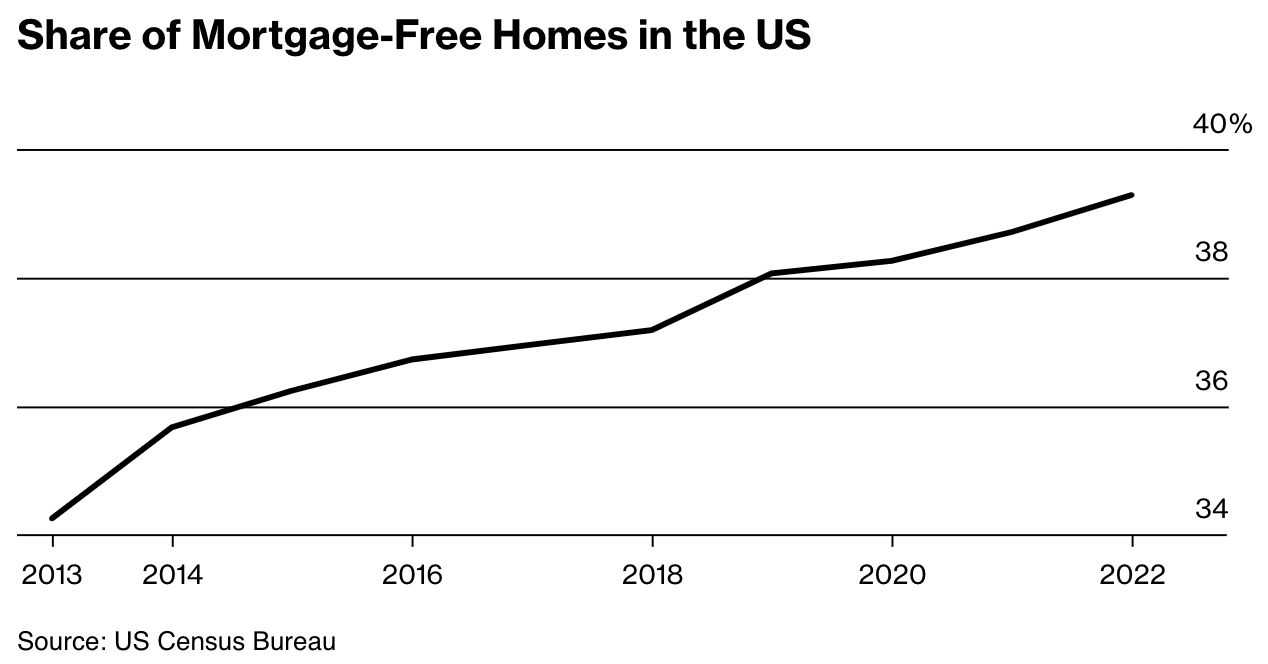
The U.S. housing market has witnessed a significant shift with a growing number of Americans, particularly baby boomers, owning their homes outright, reaching nearly 40% in 2022, a 5% increase from 2012.
Despite traditional financial advice favoring investment over early mortgage payoff, many homeowners find psychological relief and security in owning their homes outright.
The overall increase in mortgage-free homes reflects a preference among older homeowners to age in place or relocate to more affordable areas, underlining a significant transformation in the U.S. housing landscape.
Chart That Caught Our Eye
Analyst Team Note:
A stable macro outlook and much more optimistic view on rates has taken BofA’s survey of fund manager’s equity allocation overweight for the 1st time since Apr’22.
Investors increased allocation to equities from net 4% underweight to net 2% overweight in November.
Sentiment Check
Make sure to check Larry’s most recent market updates via his personal newsletter.