In this macro environment, for consumer goods, we highly recommend free apps such as Rakuten and Upside (Upside code: LARRY25) for finding the best deals and spending intelligently. Very good services and easy ways to save smartly.
Note from Tim Chang:
Key Investing Resource: Strategist Larry uses Interactive Brokers as his core brokerage. Feel free to check out IB. I currently park excess cash at Interactive Brokers. Check it out. It’s a great brokerage.
For Consumer goods to save on deals, I use Rakuten for finding the best pricing on all popular items. First-time users get $30 for free.
In our emails, we will provide the following coverage points:
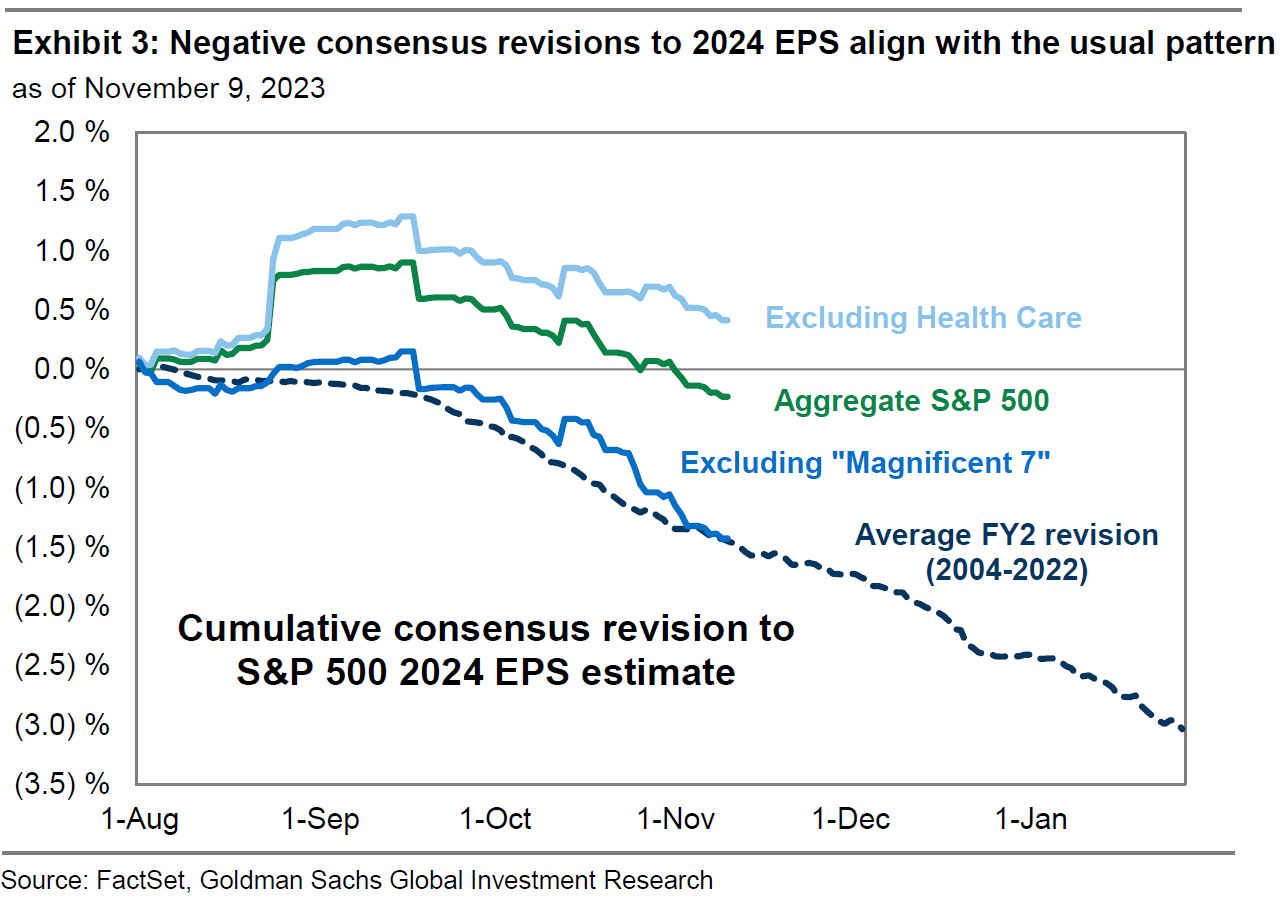
Goldman Sachs suggests that the concerns over a weakening outlook for US corporate earnings might be overstated. They note that the recent 4% drop in fourth-quarter profit estimates since October for S&P 500 companies is part of a historical pattern, with expectations for 2024 showing a similar trend, dipping only 0.4% when excluding the healthcare sector, which has been a significant drag.
This pattern of declining quarterly earnings per share estimates by about 6% in the months before earnings season has been consistent since 2004.
Despite concerns about negative consensus earnings revisions, the strategists point out that over 80% of S&P 500 companies have outperformed estimates in the third-quarter earnings season, with earnings up by 4% from the previous year against expectations of no growth.
Looking ahead, Goldman Sachs predicts a 5% rise in S&P 500 earnings-per-share in 2024 to $237, slightly higher than the median forecast of $230, while Morgan Stanley anticipates a rise to $229.
Macro Chart In Focus
Analyst Team Note:
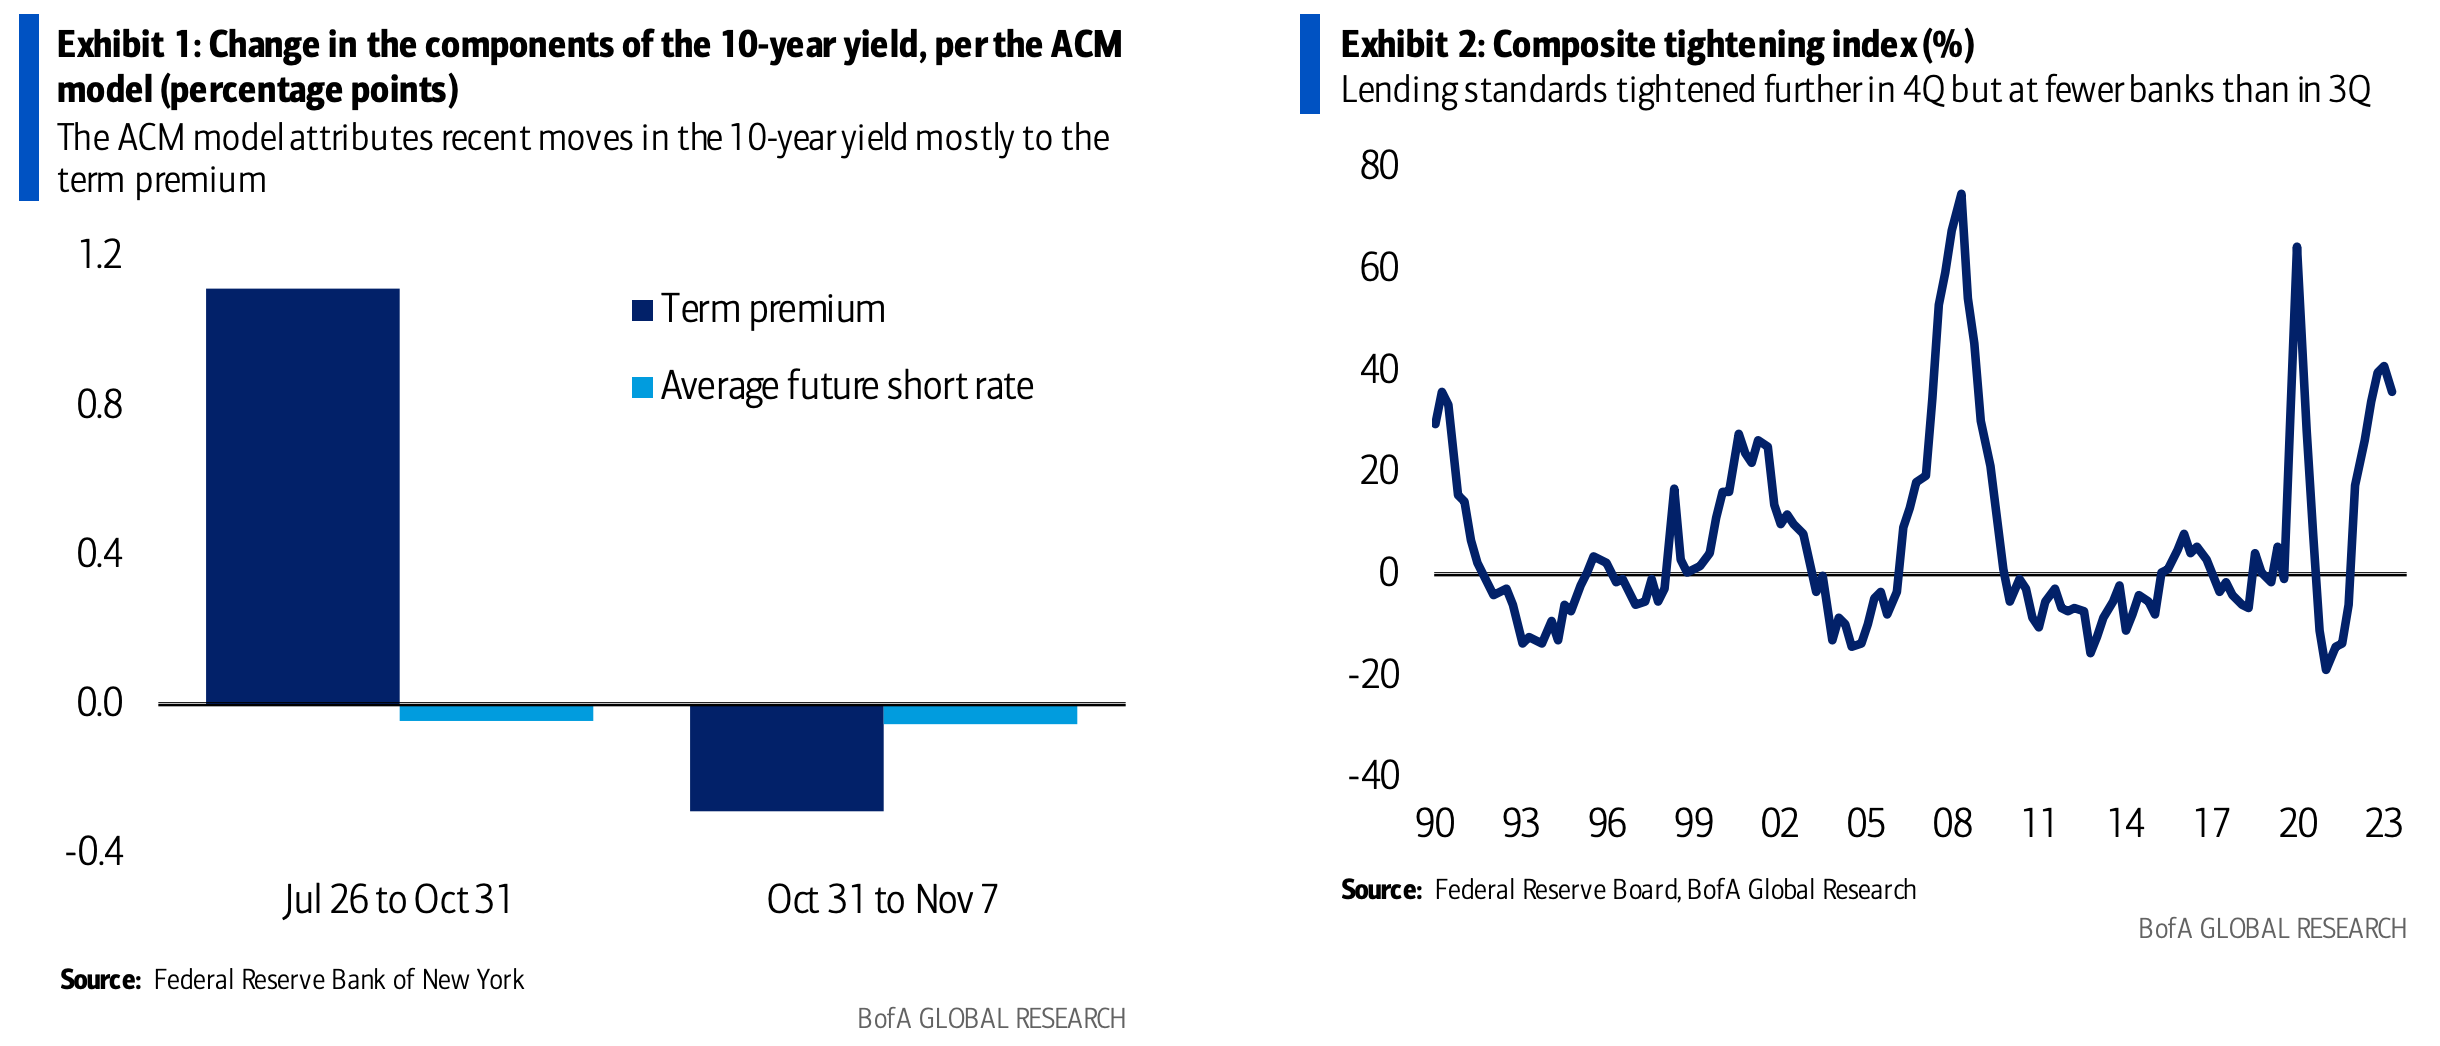
In the lead-up to the November FOMC meeting, the debate centered around the impact of financial tightening on Federal Reserve policy. Several FOMC members cited the increase in the 10-year Treasury yield as a reason for policy caution.
Chair Powell argued that this tightening was exogenous, not merely a reflection of expectations for a more restrictive Fed policy. However, this view was challenged, with arguments that long-end yields are primarily influenced by Fed policy expectations.
Recent market trends following the Fed meeting suggest that financial conditions are indeed closely tied to Fed policy. This creates a challenging situation for the Fed, as it navigates a complex, circular relationship between financial tightening and its policy responses;
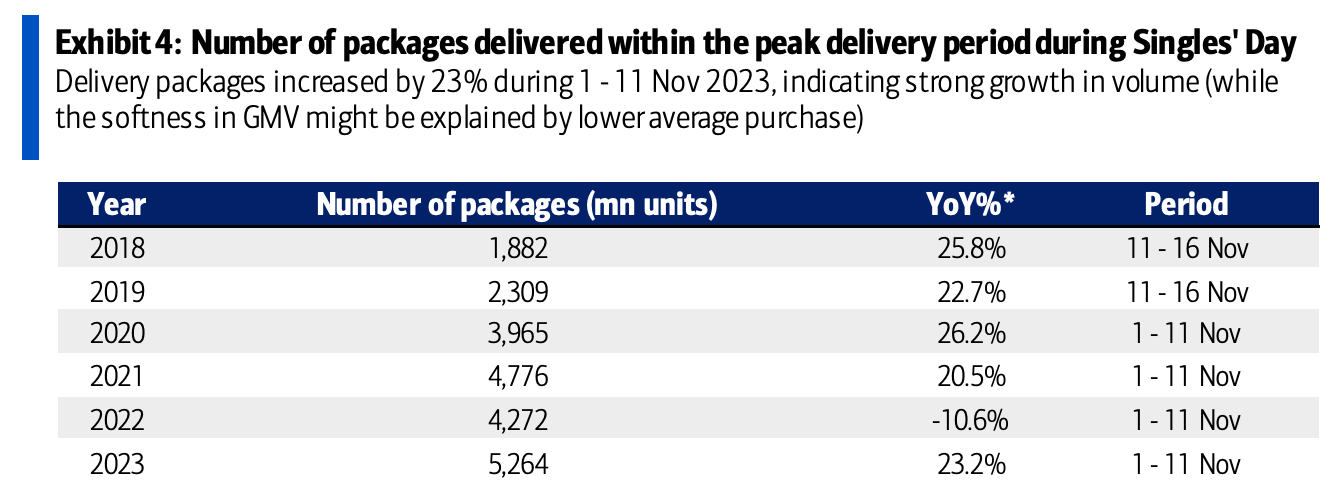
Singles Day 2023 in China, a significant online shopping event, indicated a slowdown in consumer spending recovery amidst persistent economic challenges and fragile consumer confidence.
The total Gross Merchandise Volume (GMV) showed only a slight increase, marking a notable deceleration from the robust double-digit growth seen in previous shopping festivals such as 618 in 2023, and both Singles Day and 618 in 2022.
Traditional e-commerce experienced a minor year-over-year decline, contrasting with previous single-digit growths, although livestreaming platforms still saw teen-level growth, albeit slower than before.
The increase in the number of delivered packages suggests a rise in volume, but the overall GMV softness points towards lower average spending per purchase, reflecting a shift towards value-conscious shopping.
Chart That Caught Our Eye
Analyst Team Note:
Morningstar's annual retirement income report revised the safe annual withdrawal rate for retirees from 3.8% last year to 4% this year. This increase is attributed to higher bond yields and a relatively optimistic outlook on long-term inflation.
The report, which examined real-life returns and rates in a variety of market scenarios, suggests a 90% probability of funds lasting over 30 years at this withdrawal rate. The analysis is based on a conservative portfolio mix of 20-40% stocks, 10% cash, and the remainder in bonds.
Notably, the forecast for 30-year returns on U.S. investment-grade bonds has risen to 4.93%, with a projected long-term inflation rate of 2.42%.
However, the safe withdrawal rate decreases to 3.8% for portfolios with 70% in stocks, despite a higher median ending balance after 30 years.
The report highlights the impact of market conditions at the time of retirement and asset allocation on withdrawal rates, noting that while a 4% rate is a popular guideline, higher rates like 5% might be possible with adjustments such as reducing withdrawals in down markets or skipping inflation adjustments.
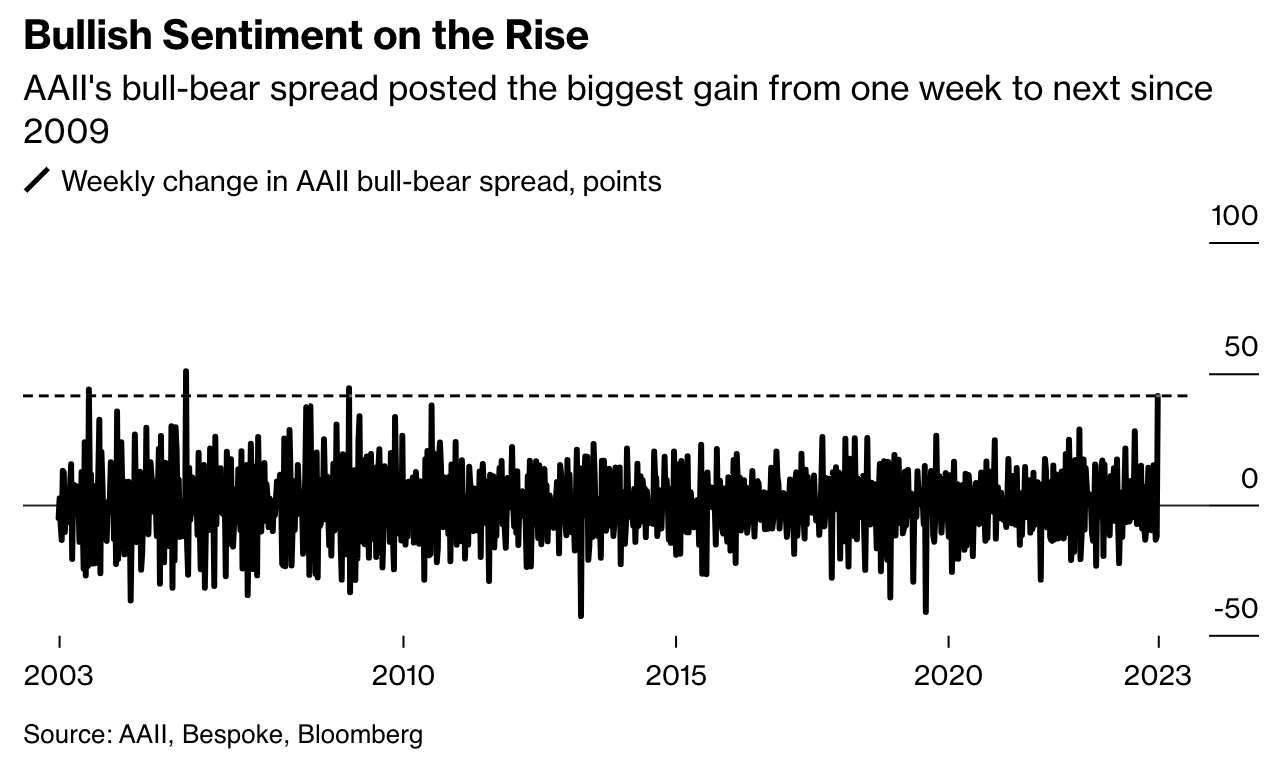
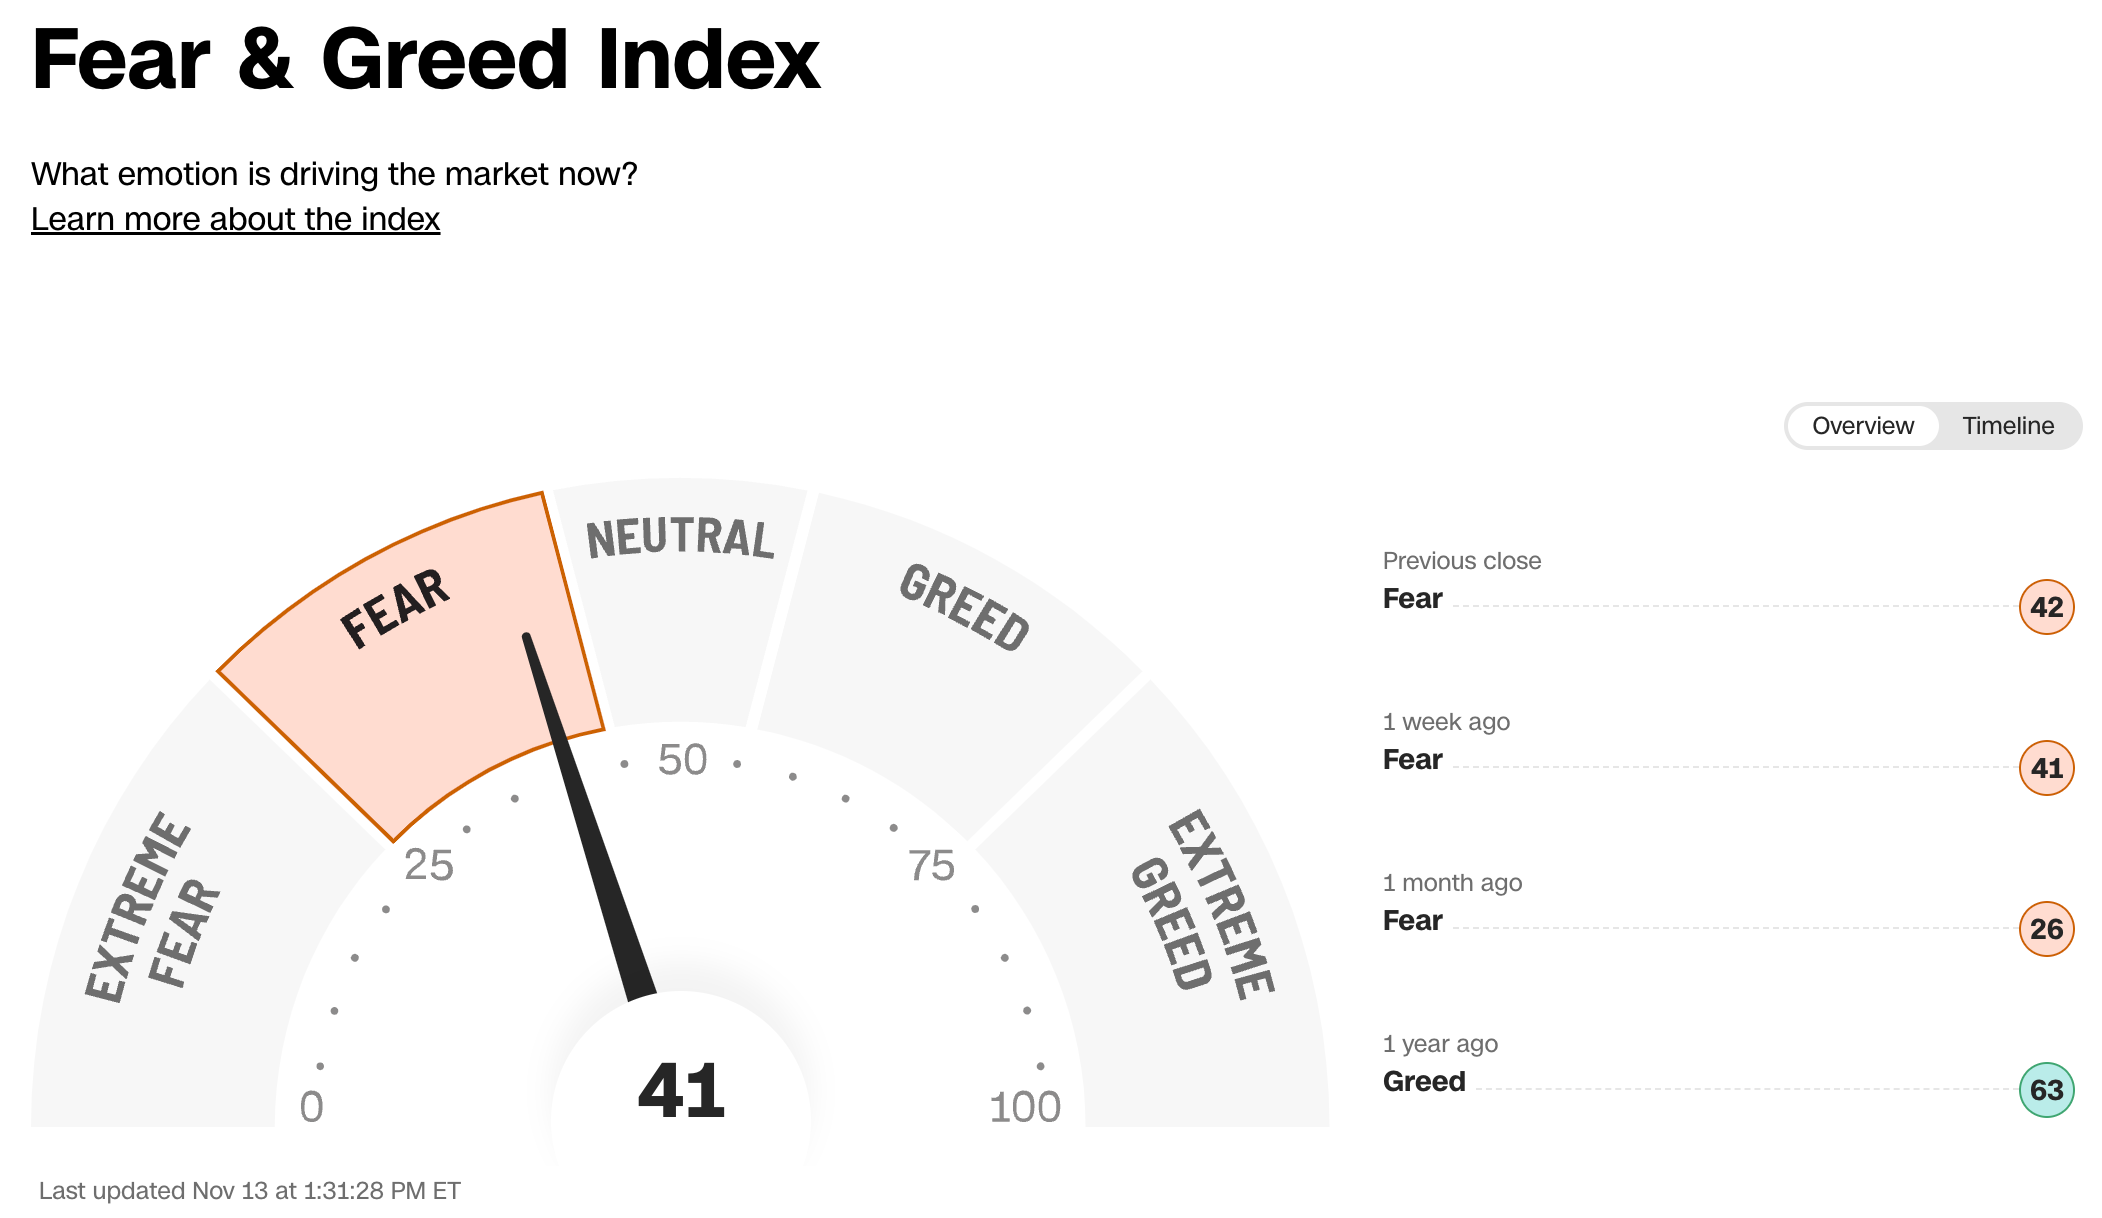
Sentiment Check
Make sure to check Larry’s most recent market updates via his personal newsletter.