Make sure to check out Interactive Brokers above as idle cash now will yield more than 4.5% as the Fed just raised rates.
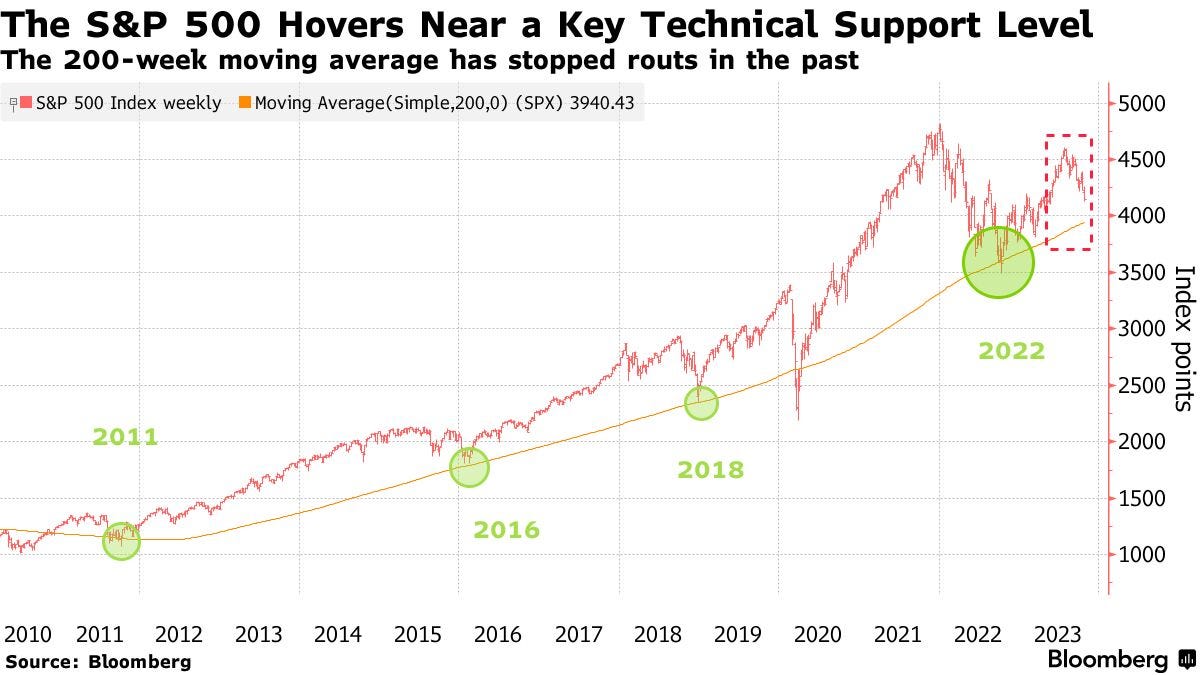
Note from Tim Chang: More than two-thirds of stocks for companies in the S&P 500 index are trading below their 200-day moving averages, according to an analysis by Bloomberg Intelligence.
Key Investing Resource: Strategist Larry uses Interactive Brokers as his core brokerage. Feel free to check out IB. I currently park excess cash at Interactive Brokers. Check it out. It’s a great brokerage.
In our emails, we will provide the following coverage points:
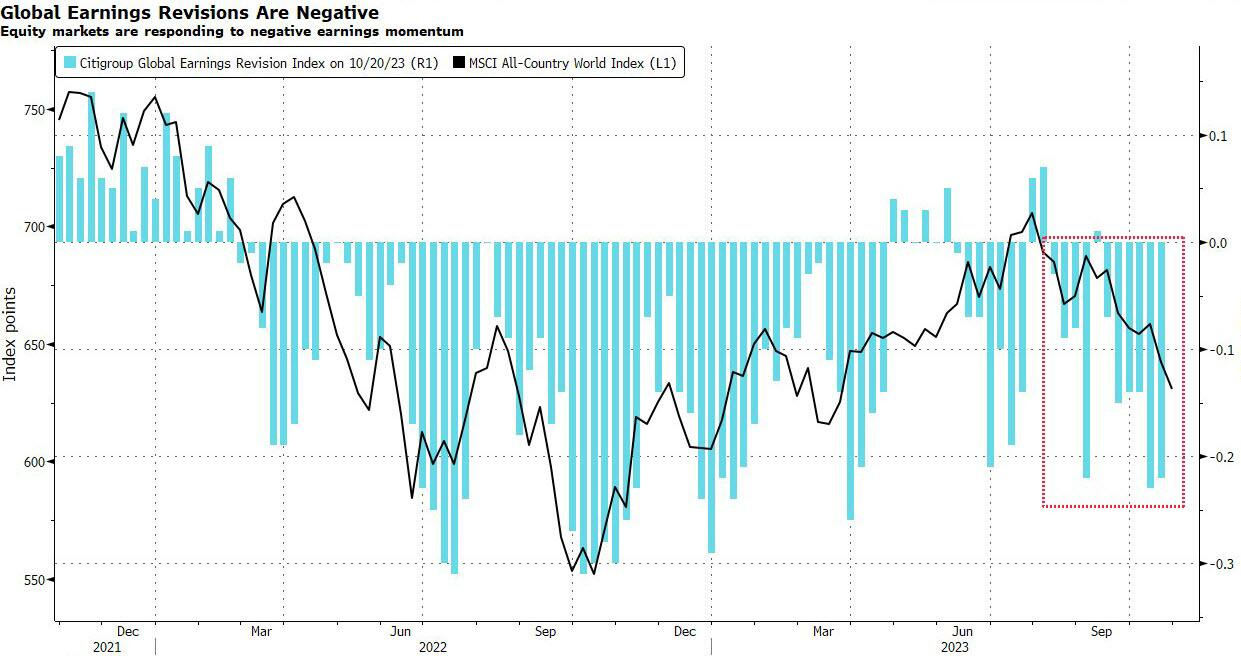
Global stocks, already reeling from a $8.5 trillion decline in less than three months, found no relief in corporate earnings, further dimming hopes for a year-end rally.
The MSCI All-Country World Index dipped 3.5% since US banks initiated the Q3 reporting season in mid-October, totaling over 10% decline since July.
Disappointing earnings from US and European firms due to high costs and declining consumer demand, coupled with a surge in US bond yields and geopolitical tensions, exacerbated the situation.
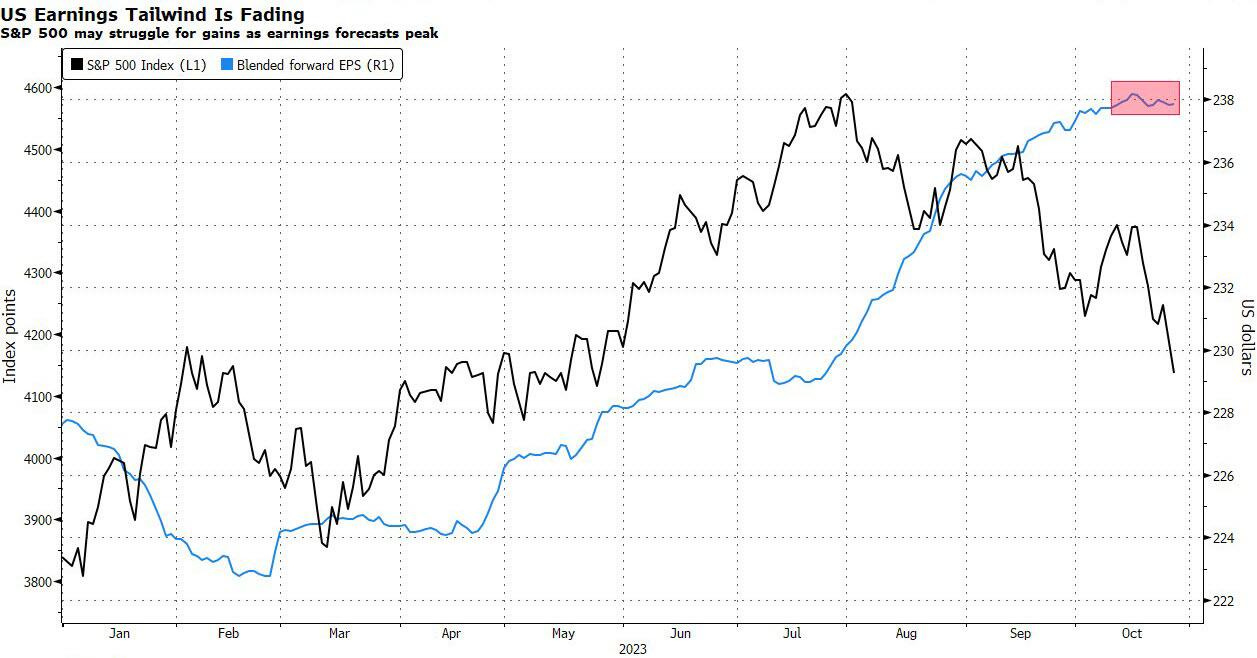
Despite some US companies exceeding expectations, the prevalent earnings concerns, margin pressures, and a stagnant outlook for US profit projections for 2024 have led investors to seek value in other asset classes like bonds.
Macro Chart In Focus
Analyst Team Note:
The Federal Reserve's favored core PCE index rose by 0.3% in September, reflecting an accelerated inflation rate at a four-month high, bolstered by a 0.4% uptick in inflation-adjusted consumer spending, according to a report by the Bureau of Economic Analysis.
Despite the expectation of a slowdown in consumer spending and a likely unchanged benchmark interest rate in the next Federal Reserve meeting, the robust data presents upside risks.
Concerns arise from the service-sector prices increase and a decrease in the saving rate to 3.4%, reflecting a potential strain on consumers' ability to maintain spending, especially with the looming resumption of student loan payments and high borrowing costs.
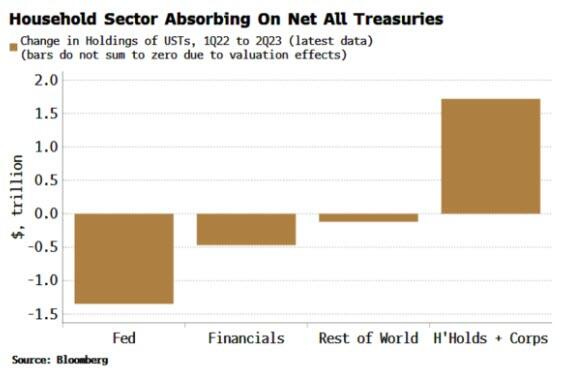
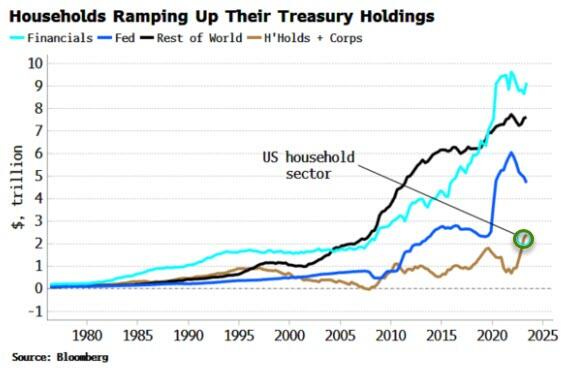
US households, traditionally the smallest holders of Treasuries, have increased their holdings by $1.7 trillion to $2.4 trillion in less than two years as the Federal Reserve, financial firms, and global investors reduce their exposure to US Treasury bonds.
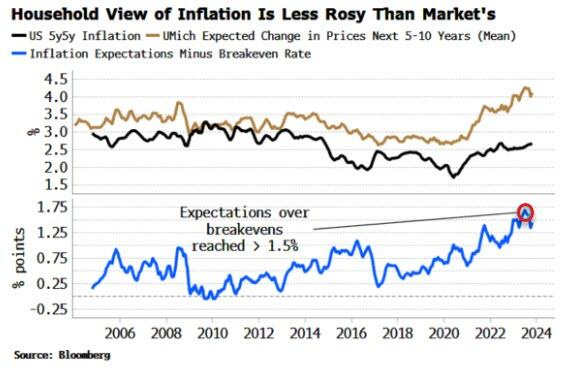
According to Bloomberg, as households become the primary buyer of Treasuries, yields may need to rise by up to 1.5 percentage points to meet their elevated inflation expectations.
The world is adjusting to higher rates, with US 10-year yields surpassing 5% for the first time since 2007.
Yields may need to climb even further as other sectors continue to decrease their Treasury holdings, and households demand greater yield compensation for the risks associated with heightened inflation.
Chart That Caught Our Eye
Analyst Team Note:
The VIX, also known as Wall Street's fear gauge, is signaling increasing anxiety among investors due to escalating tensions in the Middle East and ongoing turbulence in the bond market.
This week, the nearest futures contracts tied to the VIX closed in a pattern known as backwardation, indicating that traders anticipate more volatility in the near term than in the future.
This pattern typically occurs during stock market troughs.
Despite the S&P 500 Index's declines, the VIX Index itself remains below levels typically associated with major equity sell-offs.
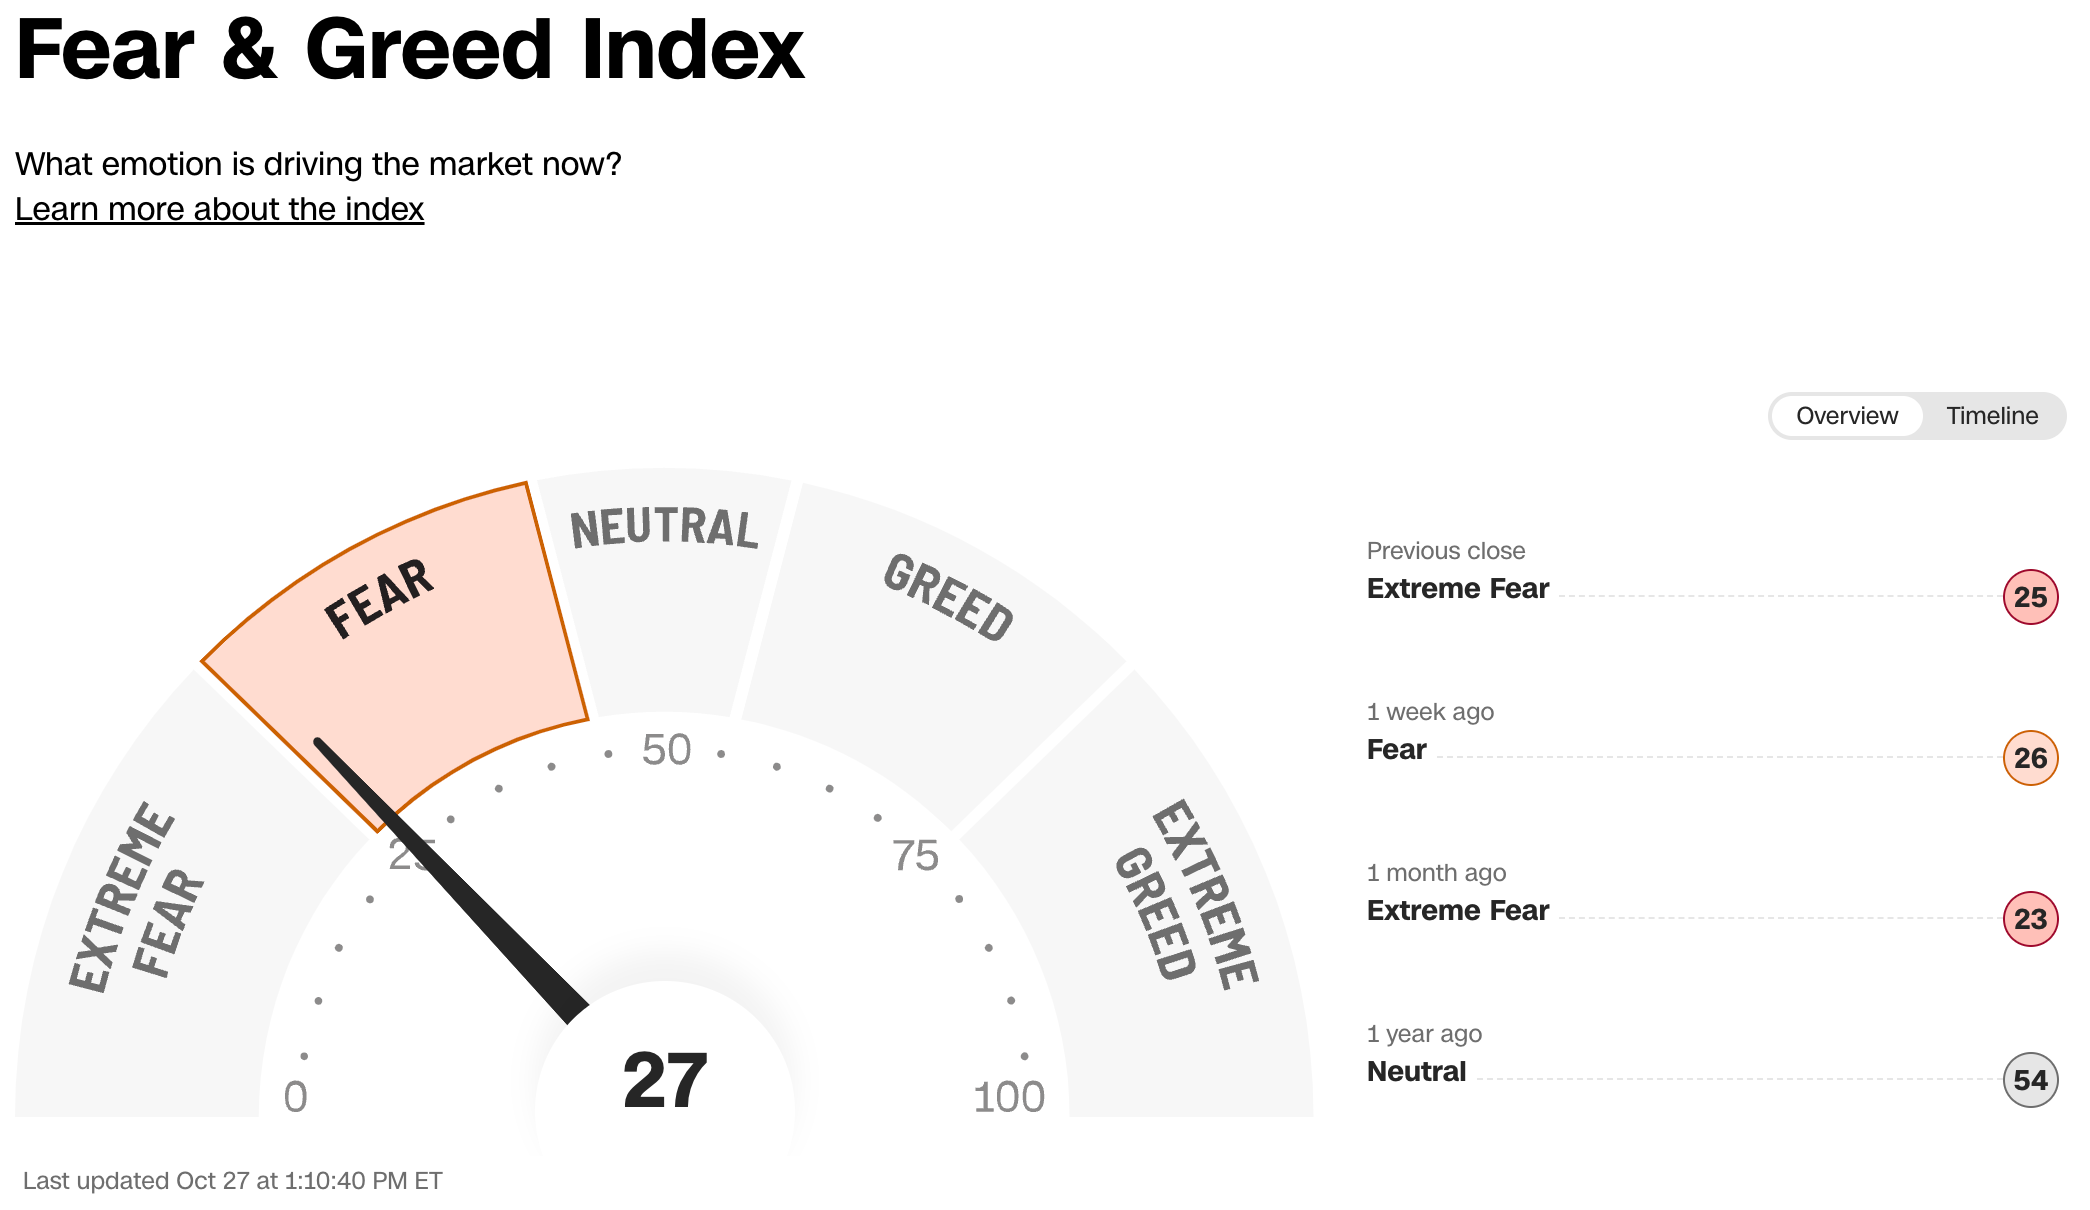
Sentiment Check
Make sure to check Larry’s most recent market updates via his personal newsletter.