Make sure to check out Interactive Brokers above as idle cash now will yield more than 4.5% as the Fed just raised rates.
Note from Tim Chang: Washington DC’s deal over the weekend to avoid a government shutdown gave stocks only a brief respite as the focus in markets quickly shifted back to rates, especially as rising oil prices threaten to bring back inflation.
Key Investing Resource: Strategist Larry uses Interactive Brokers as his core brokerage. Feel free to check out IB. I currently park excess cash at Interactive Brokers. Check it out. It’s a great brokerage.
In our emails, we will provide the following coverage points:
Despite ongoing macroeconomic uncertainties, BofA’s Sell Side Indicator, a contrarian sentiment measure reflecting sell-side strategists' average recommended equity allocation in balanced funds, remained stable at 53.5% in September, unchanged since July and below the 60% benchmark allocation.
While the S&P 500 experienced approximately 20% growth since last September, the SSI is 11bps lower than a year ago. Currently in a "neutral" state, the SSI is considerably more bearish than bullish, with indicators suggesting a potential +15% price return for the S&P 500 over the next year, reaching around 4900.
Historically, when the SSI has been at or below its current level, the following 12-month returns on the S&P 500 have been positive 95% of the time, with a median return of 21%.
Macro Chart In Focus
Analyst Team Note:
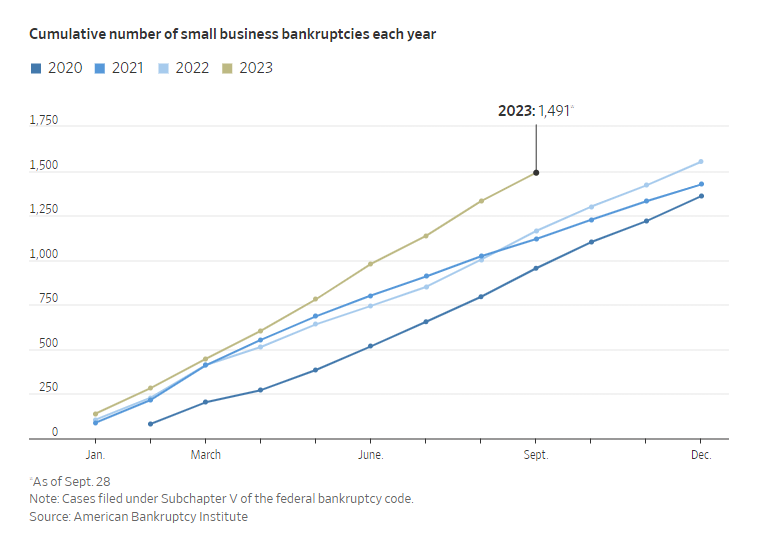
Nearly 1,500 small businesses filed for Subchapter V bankruptcy this year through Sept. 28, nearly as many as in all of 2022, according to the American Bankruptcy Institute. Bankruptcy petitions are just one sign of financial stress. Small-business loan delinquencies and defaults have edged upward since June 2022 and are now above prepandemic averages, according to Equifax.
According to Bank of America, it takes about a year for a drop in bank lending willingness to result in rising unemployment, which implies significant risk of a potentially meaningful increase in unemployment over the next year
Chart That Caught Our Eye
Analyst Team Note:
Oil has recently experienced its largest quarterly increase since early 2022, a surge driven by production cuts in Saudi Arabia and Russia coupled with record demand. This tightening in crude supplies has elevated the premium for West Texas Intermediate deliveries due in a month.
This scenario has led the market into a deeper state of backwardation, a term structure that shows ongoing concerns about inventory levels, prompting traders to place higher bids on nearer-term contracts.
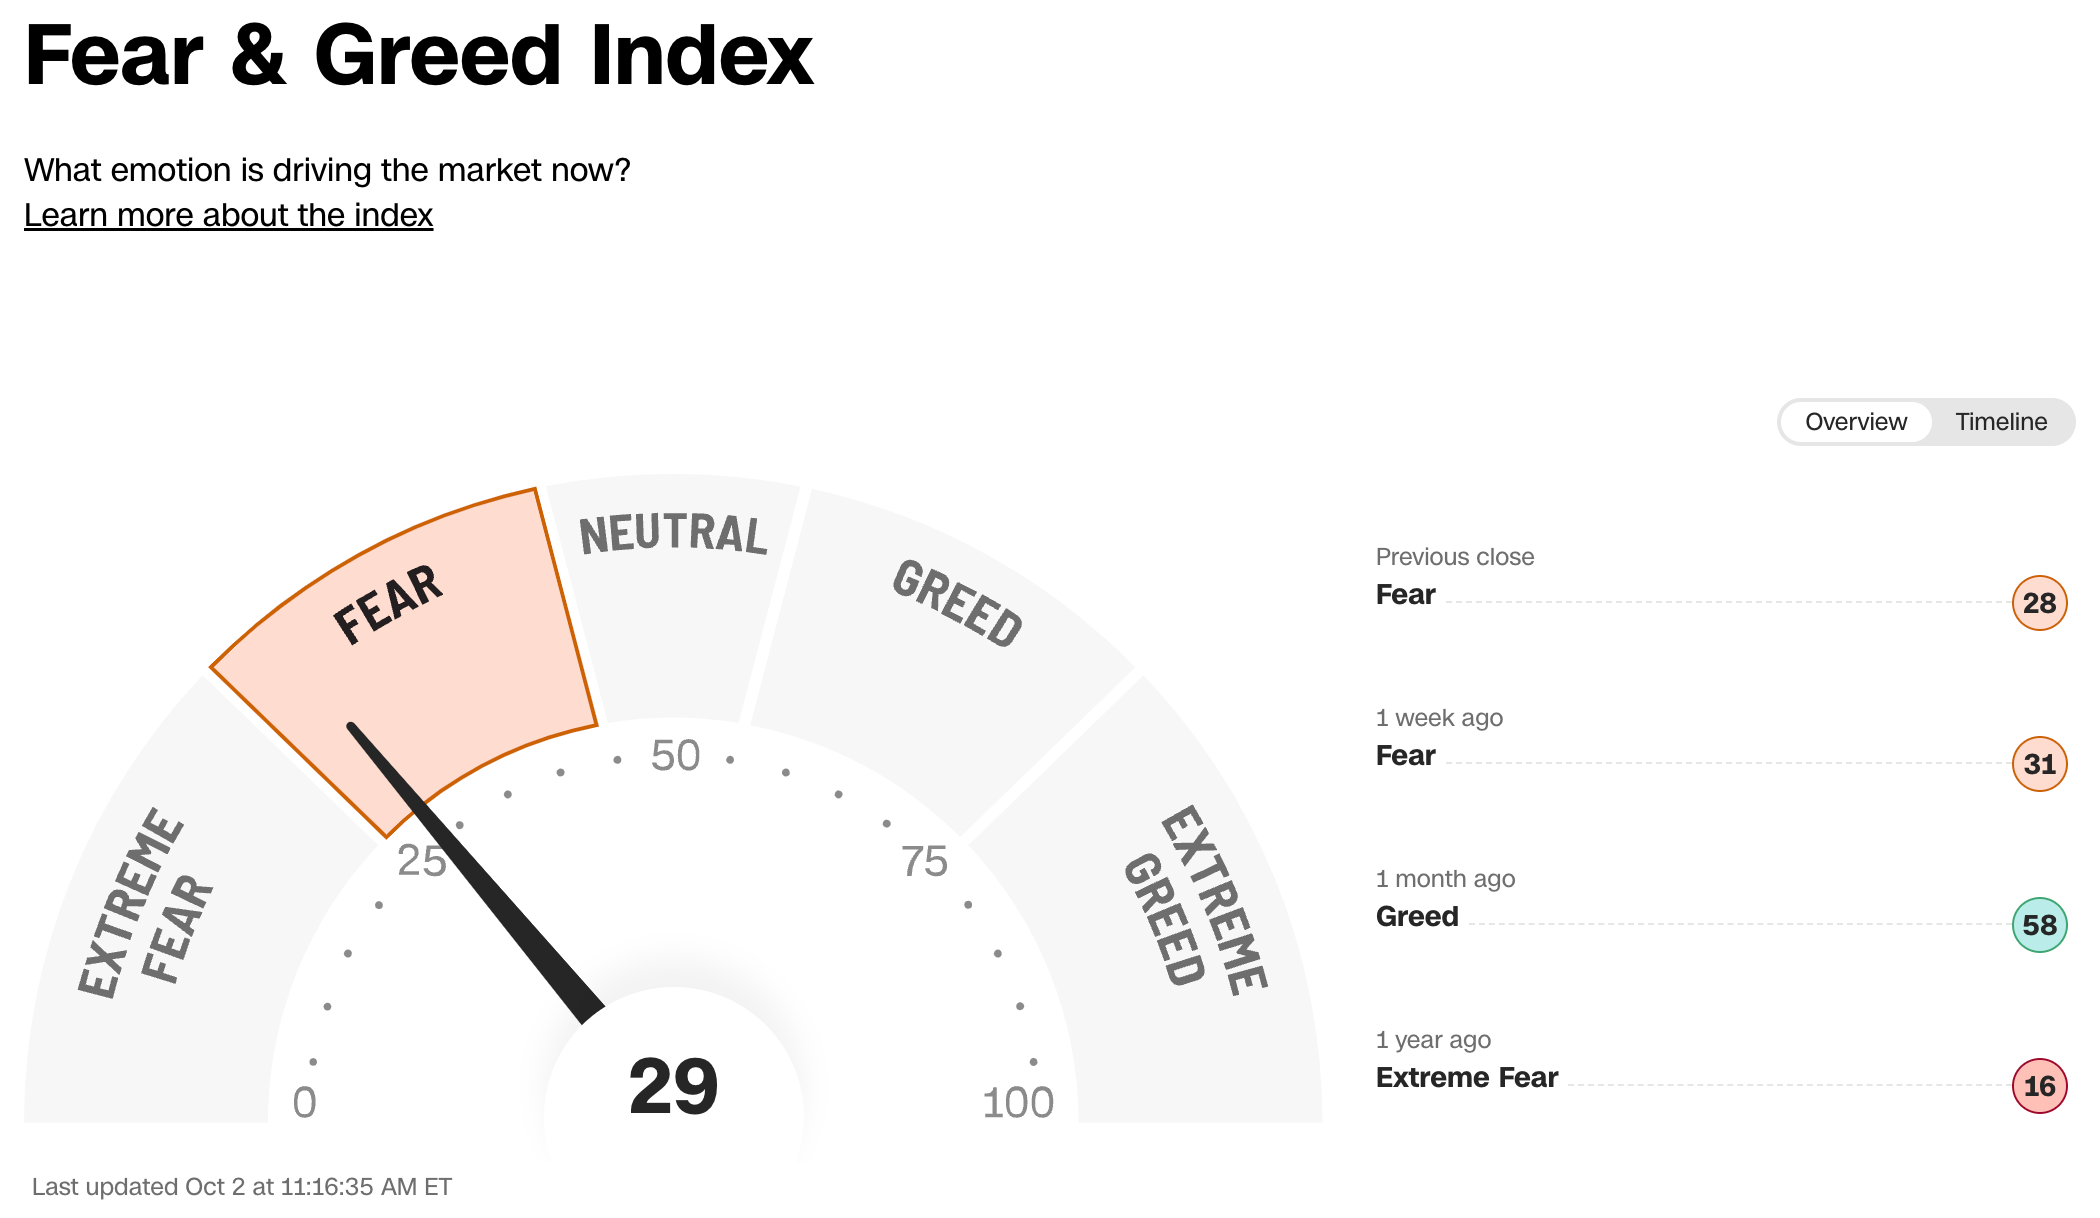
Sentiment Check
Make sure to check Larry’s most recent market updates via his personal newsletter.