Make sure to check out Interactive Brokers above as idle cash now will yield more than 4.5% as the Fed just raised rates.
Key Investing Resource: Strategist Larry uses Interactive Brokers as his core brokerage. Feel free to check out IB. I currently park excess cash at Interactive Brokers. Check it out. It’s a great brokerage.
In our emails, we will provide the following coverage points:
Historically, short-term market downturns caused by geopolitical events typically recover within three months, suggesting that these dips might be buying opportunities rather than selling points.
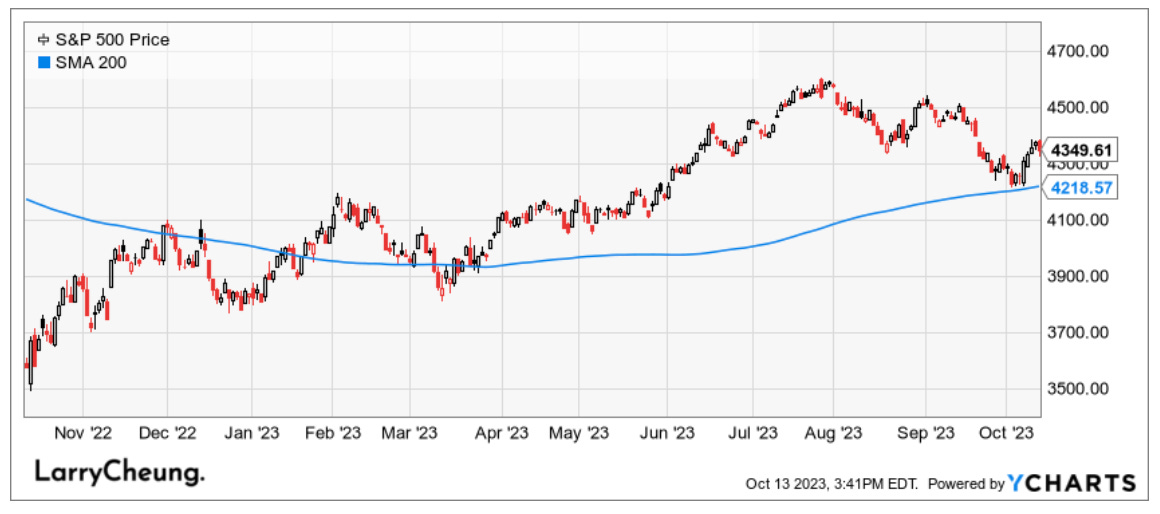
Macro Chart In Focus
Analyst Team Note:
Fewer stocks are driving benchmark returns over time. Large growth companies have taken over the market in the past two decades. In each decade, fewer and fewer stocks generate the bulk of returns.
1988-1990: 16 stocks such as Exxon and Merck comprised 23% of the Russell 1000 market cap and accounted for 23% of total returns.
2000-2002: 11 stocks comprised 20% of the Russell 1000 and accounted for half of returns.
2020-2022: 6 stocks account for 20% of the index & 71% of returns.
September CPI rose by 0.4% MoM, surpassing consensus expectations of 0.3%, maintaining the YoY rate at 3.7%. Core inflation increased by 0.3% MoM, leading to a YoY rate of 4.1%.
Energy prices, influenced by higher gasoline and electricity costs, played a significant role in boosting headline inflation, rising by 1.5% MoM. Though gasoline prices have shown signs of reduction in October, core goods prices witnessed a decline of 0.4% MoM, largely due to a 2.5% MoM drop in used car prices. At the same time, core services, especially shelter, surged unexpectedly by 0.6% MoM.
Chart That Caught Our Eye
Analyst Team Note:
US Treasuries, traditionally viewed as a stable part of investment portfolios, have recently experienced unprecedented volatility, with price swings in the world's largest Treasury ETF surpassing the S&P 500 for the first time since 2005.
Factors such as the Federal Reserve's aggressive policy tightening, significant bond sales by the US government to address deficits, and heightened geopolitical tensions in the Middle East have contributed to these fluctuations.
This shift in behavior has resulted in significant losses for long-duration bonds, with the bond ETF declining by 37% over two years.
Sentiment Check
Make sure to check Larry’s most recent market updates via his personal newsletter.